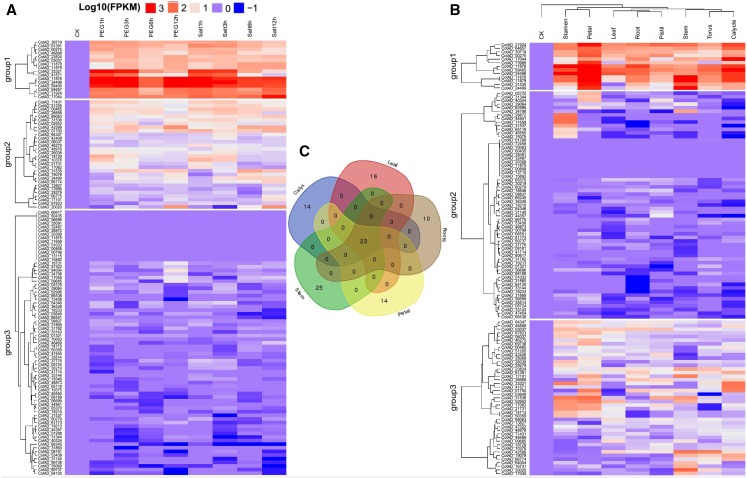
Figure 3.
Expression profile analysis of LEA2 genes in 5 upland cotton tissues. The LEA2 genes expressed (RPKM > 1) in leaf, stem, root, calyx and petal were represented according to their tissue specificity: (A): LEA2 genes RNA seq. expression profile under drought and salt stress. (B): LEA2 expression in the 8 different tissues and (C): Venn diagram quantification and common genes expressed among the 5 tissues.

