Figure 1.
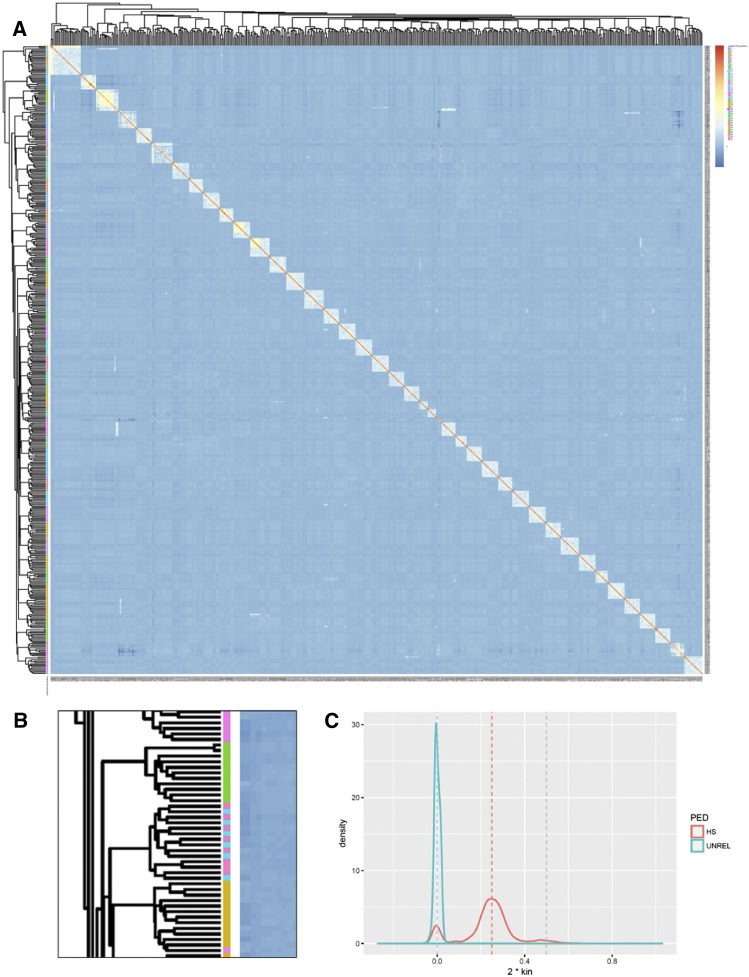
Genomic relatedness between individuals and families - A) heatmap of clustered pairwise kinship. Darker blue indicates zero kinship (i.e., unrelated), red indicates kinship of one (i.e., self or clonal) while intermediate values show varying levels of relatedness. Each individual is annotated on the y-axis with a color according to its pedigree-assigned family. B) Magnification of a section of the y-axis. Contiguous color bars demonstrate genomic relationship clustering in concordance with the pedigree. Striping indicates that the family assignment in the pedigree was mixed for two families. C) Most pedigree-based half-sib (HS) pairs show kinship in a normal distribution around the expected value of 0.25 (orange line main peak), though a number of assumed pedigree half-sibs are actually unrelated or full-sib, as indicated by their distribution around 0 and 0.50 respectively.

