Figure 2.
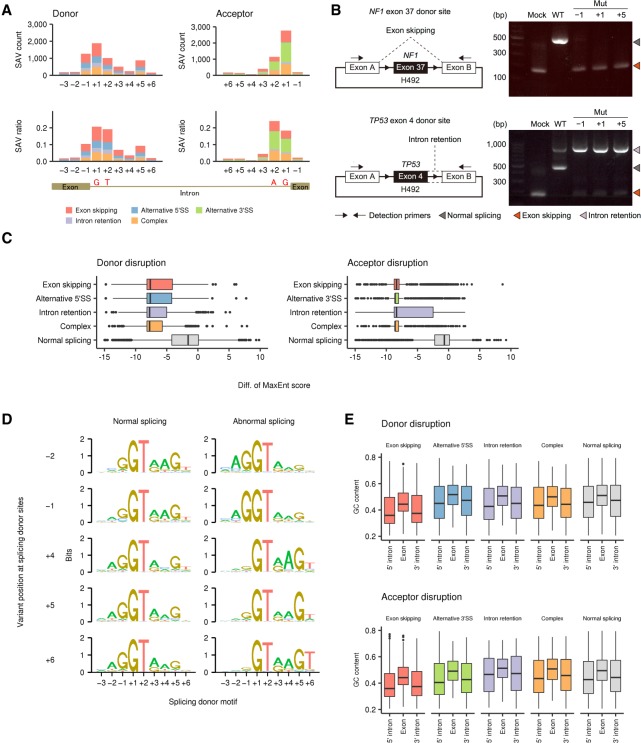
Genomic features of SS-disrupting variants generating distinct splicing alterations. (A) Number of SNVs disrupting splice donor and acceptor sites (SAV count, upper) and their fraction relative to total SNVs (SAV ratio, lower) at each position in the entire cohort. See also Supplemental Figure S2C for indels. (B) In vitro splicing analyses using H492 minigene constructs (left) showing exon skipping or intron retention (right) caused by SAVs at positions −1, +1, and +5 of NF1 exon 37 or TP53 exon 4 donor sites, respectively. (WT) Wild type, (Mut) mutated. (C) Change in splicing strength (based on MaxEnt scores) triggered by somatic variants at authentic splicing donor (left) and acceptor (right) sites according to splicing outcomes. “Complex” represents samples showing more than one splicing alteration, and “Normal splicing” represents samples lacking the relevant splicing alterations despite the presence of somatic variants in genes with detectable expression (fragments per kilobase of exon per million fragments mapped [FPKM] ≥ 10). See also Supplemental Figure S3B–E. (D) Sequence motifs of splicing donor sites at which somatic SNVs lead to normal (left) or abnormal splicing (right; identified by SAVNet) according to the variant position. See also Supplemental Figure 3, F and G. (E) GC contents of exons affected by SAVs, and their flanking 5′ and 3′ introns were compared among the five splicing groups. See also Supplemental Figure S4.

