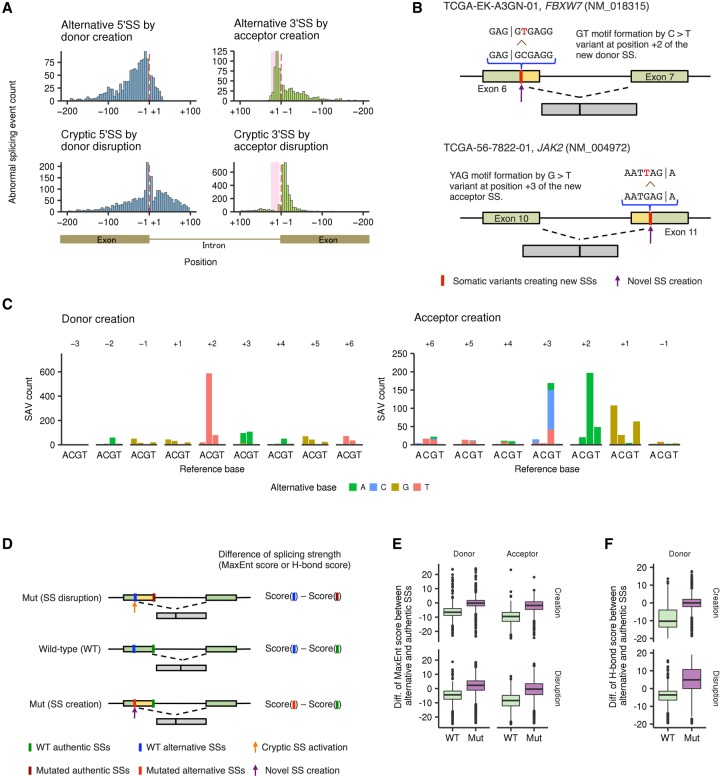
Figure 4.
Genomic features and positional differences of SS-creating SAVs. (A) Histogram showing the distribution of newly created alternative SSs (upper) and cryptic SSs caused by SS disruption (lower). Red dashed lines and pink shading represent exon-intron boundaries and polypyrimidine tract regions (positions +5 through +25), respectively. (B) Two typical examples of SS-creating SAVs (through formations of GT and YAG motifs, respectively) are displayed. (C) Base substitution patterns of SAVs creating alternative SSs according to the distance from the newly created exon-intron boundaries. Colors and axes are the same as in Figure 3A. (D) The effects of SAVs on splicing strength (based on MaxEnt or H-bond scores) for authentic or alternative SSs were assessed. For SS-disrupting SAVs, the difference in splicing strength between alternative and unsubstituted authentic SSs (WT) was compared with that between alternative and substituted authentic SSs (Mut). For SS-creating SAVs, the difference between unsubstituted alternative and authentic SSs (WT) was compared with that between substituted alternative and authentic SSs (Mut). (E,F) Box plots showing the differences of MaxEnt scores for alternative 5′ SSs and 3′ SSs (E) and H-bond scores for alternative 5′ SSs (F).

