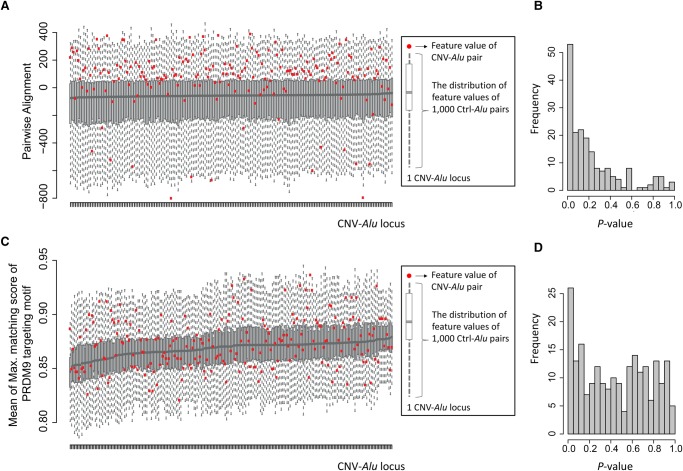
Figure 4.
Determining feature enrichment for CNV-Alu pairs with respect to Ctrl-Alu pairs. (A) The comparison of pairwise alignments between CNV-Alus (n = 219) and the corresponding Ctrl-Alu pairs (n = 1000 per CNV-Alu) is shown. The y-axis is a score showing the alignment performance, a higher value of which indicates a better alignment between two sequences. As shown in the key, at each locus, we displayed the alignment score of CNV-Alu with a red dot and showed the distribution of the Ctrl-Alus with a boxplot. The information of all the 219 events is summarized in an increasing order of the median value of the Ctrl-Alus. (B) The distribution of P-values calculated using Monte Carlo simulation for pairwise alignment is shown. (C,D) The same strategy was adopted for analyzing the mean value of the maximum matching score of the PRDM9 targeting motif within an Alu pair.

