Figure 6.
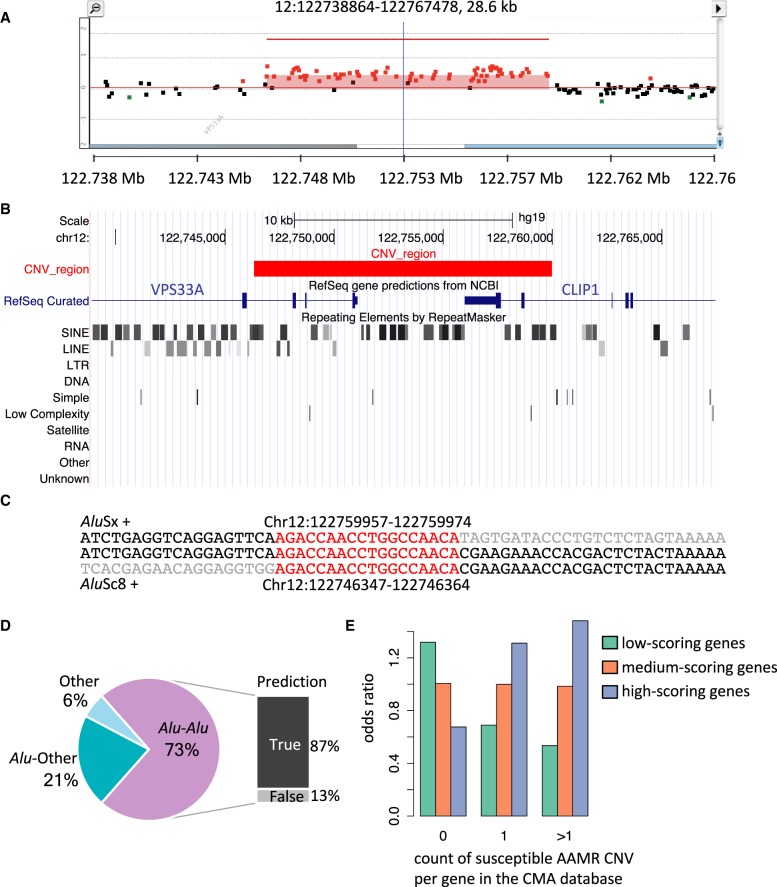
Experimental and computational validation of AAMR hotspot prediction. (A) High-density aCGH results from one individual selected from the CMA database shows a duplication of the two terminal exons of CLIP1, a predicted AAMR hotspot gene. Red dots signify probes that indicate relative copy number gain (the region indicated contains a duplication); black dots, a region unaffected by CNV; and green dots, deletion. (B) The UCSC Genome Browser image depicts RefSeq genes and RepeatMasker annotations within the same genomic interval as shown in the aCGH result. The red block represents the duplicated region. The two SINE elements, AluSc8 and AluSx, in which the breakpoints of this CNV are located are marked with red arrows. (C) The first line of sequence shows the reference sequence of the AluSx; the middle line, the sample sequence; and the bottom line, the sequence of the AluSc8. The sequences are on the plus strand, and both Alus are in the plus orientation. The sequence of microhomology at the breakpoint junction is highlighted in red. The gray sequence starts from the first mismatching base. The genomic coordinates of the microhomologies are annotated in the hg19 assembly. (D) A chart summarizing 52 breakpoint junctions mapped at nucleotide level is depicted. The CNVs are grouped into three types: Alu-Alu, CNVs mediated by an Alu pair; Alu-Other, Alu pairing with a non-Alu sequence, including LINE, LCR, and nonrepeat/repetitive sequence, mediates the CNV formation; and Other, no Alu elements were involved. For those mediated by an Alu pair, the QDA prediction result is shown to the right. True prediction indicates these Alu pairs were predicted as high risk for AAMR. (E) A box plot showing the enrichment of genes within different risk score tertiles among three classes of the count of susceptible AAMR CNVs in the CMA database.

