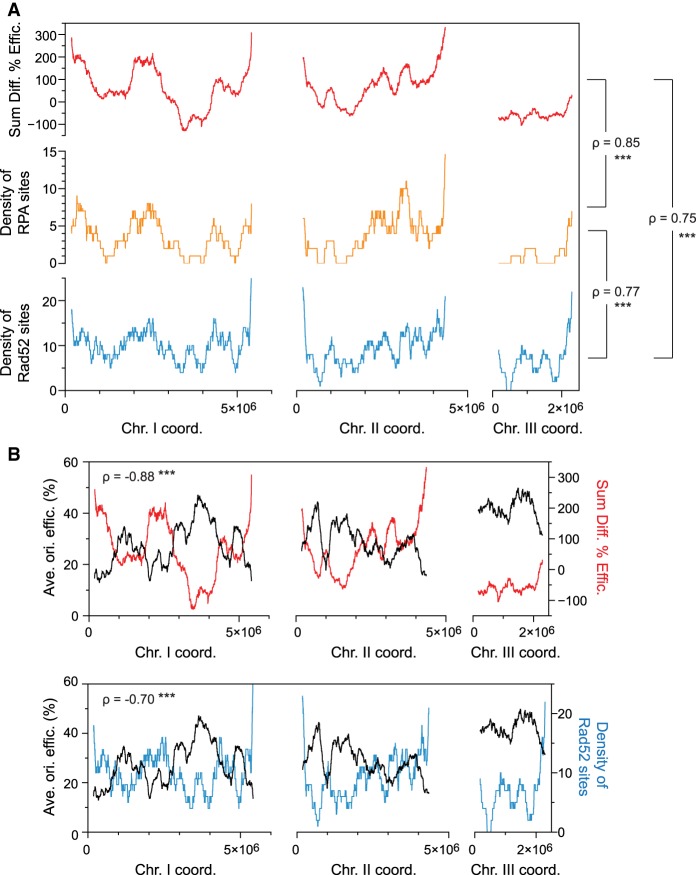
Figure 4.
The profile of origin de-regulation delineates the profiles of RPA and Rad52 binding in replication stress. (A) Genome-wide comparisons of origin de-regulation and genome instability. This analysis takes into account all 876 identified origins as well as all RPA and Rad52 binding sites. The sum of the changes in origin efficiencies upon HU treatment (rad3Δ − WT, red) was determined in continuous 1000-probe windows. The densities of RPA (orange) and Rad52 (blue) sites were calculated for HU-treated rad3Δ cells over the same windows. x-axis: chromosome coordinates; y-axes: sum of the differences in origin efficiencies (top), density of RPA sites (middle), density of Rad52 sites (bottom). The Spearman's correlation coefficients (ρ) for the different comparisons are indicated and show strong positive correlations. (***) P-value < 0.001. (B) Relationship between the wild-type replication program, the checkpoint regulation of origin firing, and genome instability during replication stress. The Spearman's correlation coefficients are indicated. (***) P-value < 0.001. Top: The profile of average origin efficiencies in wild-type cells as in Figure 1C (black, left y-axis) is displayed together with the sum of the changes in origin usage as in A (rad3Δ − WT, red, right y-axis). x-axis: chromosome coordinates. These two parameters show a strong negative correlation. Bottom: A strong negative correlation is also observed between the replication program (black, left y-axis) and the density of Rad52 (blue, right y-axis, as in A along the chromosomes. x-axis: chromosome coordinates.

