Figure 6.
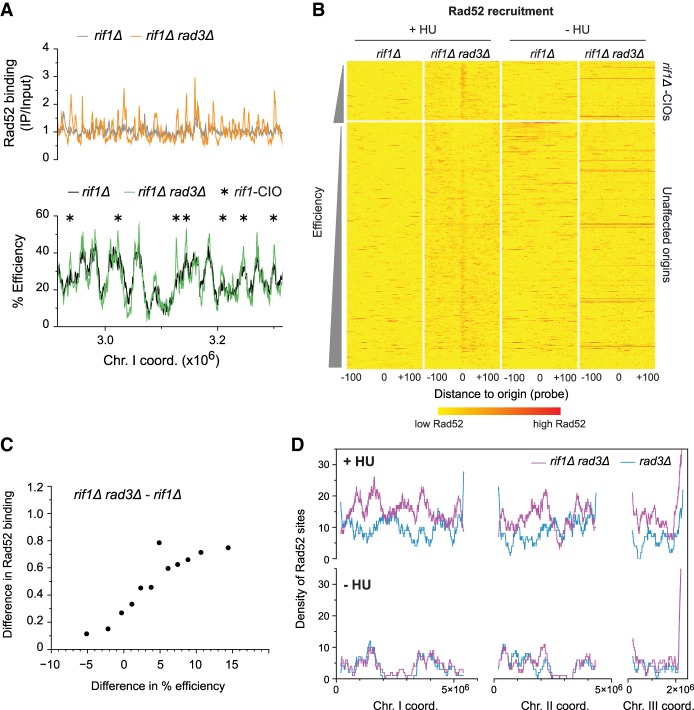
Alteration of the replication program results in genome-wide changes in Rad52 accumulation. (A–D) rif1Δ and rif1Δ rad3Δ cells were synchronized using cdc25-22 and released in 6 mM HU except where indicated. (A) Rad52 binding and origin usage in a representative region of the genome. Top: profiles of Rad52 recruitment in rif1Δ (gray) and rif1Δ rad3Δ (orange). The full Rad52 profiles are in Supplemental Figure S6D, top panel. y-axis: Rad52 binding (IP/input). Bottom: origin efficiencies for rif1Δ (black) and rif1Δ rad3Δ (green). Asterisks mark rif1-CIOs. y-axis: origin efficiency. The full origin efficiency profiles are in Supplemental Figure S5C. x-axis for top and bottom: chromosome coordinates. (B) Heat maps of Rad52 binding centered on origins in rif1Δ and rif1Δ rad3Δ cells treated with 6 mM HU (left, +HU) or in the absence of HU (right, −HU). Presentation is as in Figure 3B. Note that, as in Figure 3B, there are a few red horizontal lines in rif1Δ rad3Δ in –HU; these represent high levels of Rad52 recruitment to the end of the right arm of Chromosome III (Supplemental Fig. S6D), which we have not further investigated in this study. (C) Correlation between changes in origin usage and in Rad52 binding between rif1Δ rad3Δ and rif1Δ cells. Analysis is as in Figure 3D. x-axis: difference in origin efficiency; y-axis: difference in Rad52 binding. (D) Density of Rad52 sites in rif1Δ rad3Δ (purple) vs. rad3Δ (blue, as in Fig. 4A) calculated over continuous 1000-probe windows. Top panel: +HU; bottom panel: −HU. x-axis: chromosome coordinates; y-axes: density of Rad52 sites.

