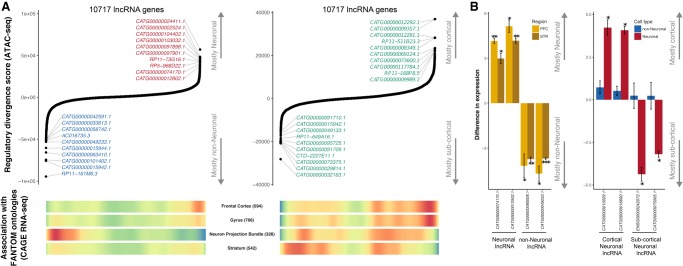
Figure 6.
Identification of cell- and region-specific regulation of lncRNA. (A) Top ranking of lncRNA genes based on their regulatory divergence score averaged across all neuronal versus all non-neuronal samples (left) and cortical neuronal samples versus subcortical neuronal samples (right). The regulatory divergence score is a combined measure of the difference in the regulatory burden for each gene multiplied by how different the regulatory landscape is surrounding that gene (Methods). lncRNA genes were obtained from the FANTOM CAT Robust category, from which only genes from the category “far from protein-coding genes” were retained. Genes with coding status “uncertain” were excluded. (Bottom) Heatmaps of whether gene expression (CAGE) identified genes associated with the given anatomical structure. “Neuron Projection Bundle” includes samples from the corpus callosum and the optic nerve, which are depleted in neuronal nuclei. Red indicates a high gene density, and blue indicates a low gene density. Numbers in parentheses indicate the number of lncRNAs associated with the ontology. (B) qPCR validation of cell-type–specific (left) and brain region–specific (right) lncRNA identified by a regulatory divergence analysis based on ATAC-seq data. Shown are fold differences in expression for neuronal (positive values) to non-neuronal (negative values) gene expression (left) and cortical (positive values) to subcortical (negative values) (right). Error bars indicate standard deviation. (PFC) prefrontal cortex; (STR) striatum; (*) P < 0.05; (**) P < 0.01; (***) P < 0.005.

