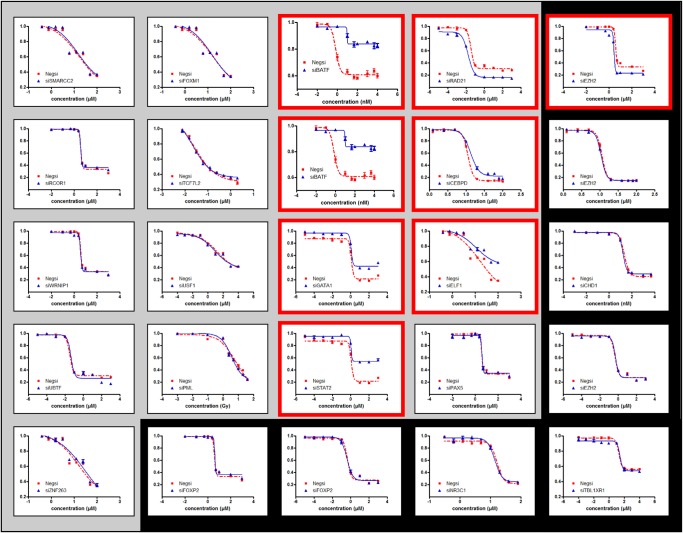
Figure 3.
All 25 experimentally tested (TF, Drug) dosage-response curves. Red outlines indicate significant shifts in cytotoxicity between siRNA negative and siRNA TF conditions. Curves with a gray background are eQTL + M predictions, while those with a black background are negative controls. We confirmed seven out of 17 predictions and only one out of eight negative controls.

