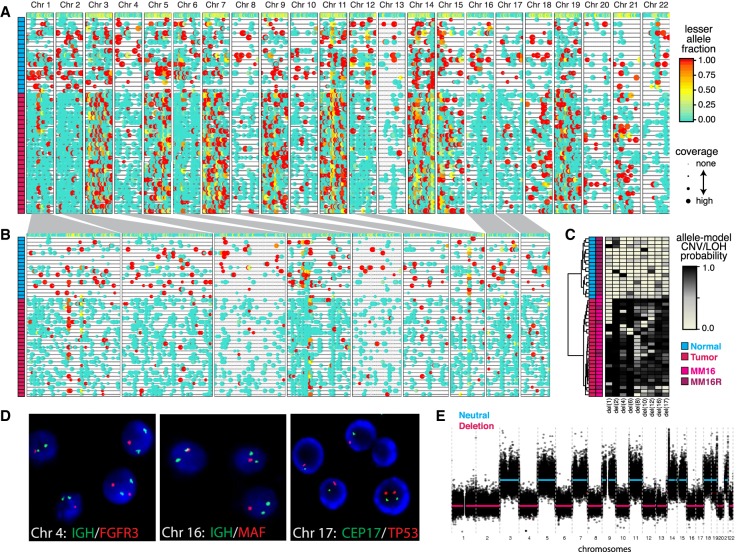
Figure 3.
HoneyBADGER analysis of 44 multiple myeloma (MM) cells. (A) Lesser allele profiles where each column is a heterozygous SNP and each row is a single cell. Points are colored by the lesser allele fraction, with yellow suggesting equal detection of both alleles and red and blue indicating monoallelic detection in either direction. Points are sized by coverage at the SNP site in the given cell. Cells are ordered based on row dendrogram in C. (B) Allele profiles for regions identified by HoneyBADGER as potential CNV or LOH regions. Width corresponds to size of region. Cells are ordered based on row dendrogram in C. (C) Heatmap of posterior probability of CNVs or LOHs in each identified region where each column is a region and each row is a cell. Row side-colors annotate cells as originating from MM16 or MM16R and as classified as normal or tumor. (D) Interphase FISH and cytogenetics of cells from MM16. Of the 200 cells analyzed, 82.5% had a single D17Z1 and TP53 signal; 79.5%, a single MAFB (20q12) signal. The sample analyzed is estimated to have 81%–95% tumor purity by SDC1+. Representative cells shown. (E) Copy number inference by bulk WES for MM16.

