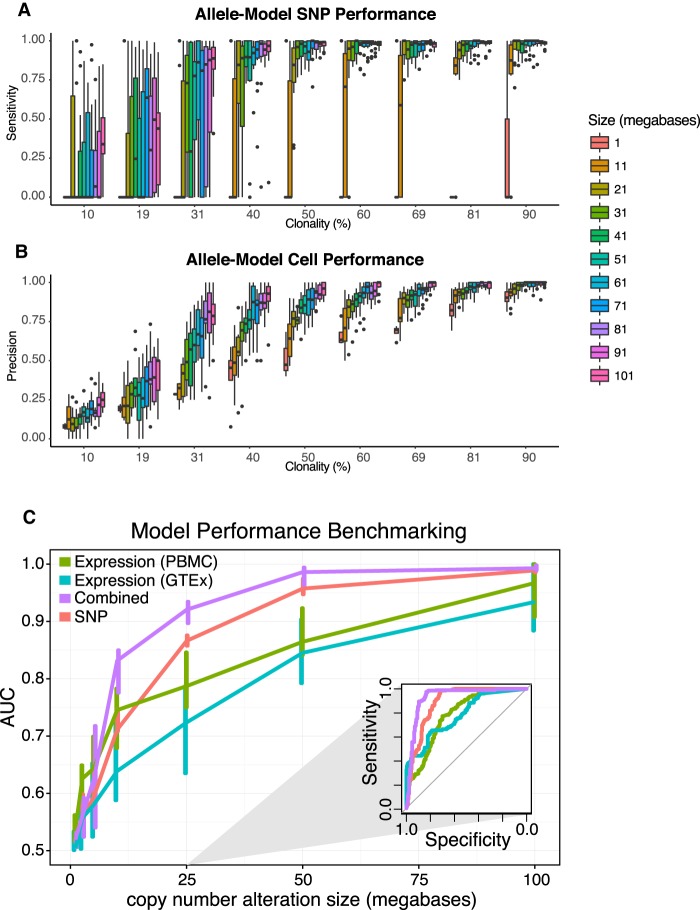
Figure 4.
HoneyBADGER performance as a function of clonality and CNV size. (A) Allele-model sensitivity for identifying SNPs affected by deletion. (B) Allele-model precision for distinguishing tumor (cells with deletion) from normal (cells without). (C) Prediction performance of HoneyBADGER's posterior probability estimates as a function of deletion size. Four different HoneyBADGER models are shown using different colors: expression-only model with PBMC and CD19+ expression normalization reference (green); expression-only model with normal blood GTEx expression normalization reference (blue); expression and SNP combined model (purple); and SNP-only model (red). Inner quartile range is indicated by the vertical lines. Performance was quantified by ROC AUC. (Inset) Representative ROC curves for a simulated 25-Mb deletion.

