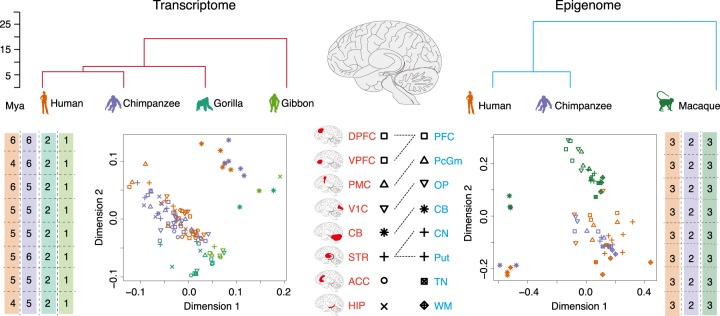
Figure 1.
Primate brain transcriptome and epigenome data sets. (Top) The trees show phylogenetic relationship among species for transcriptome (red) and epigenome (blue) data sets. The silhouette figure colors mark species identity throughout the figure. (Mya) Million years ago. (Bottom center) Locations of brain regions, corresponding symbols, and labels included in the transcriptome (red) and epigenome (blue: [PFC] prefrontal cortex; [PcGm] precentral gyrus; [OP] occipital pole; [CN] caudate nucleus; [Put] putamen; [CB] cerebellum; [WM] white matter; [TN] thalamic nuclei) data sets. The dashed lines show brain regions shared between the data sets. (Bottom, sides) The numbers of biological replicates for each of the brain regions and plots showing two dimensions resulting from the multidimensional scaling (MDS) analyses of the transcriptome (left) and epigenome (right) data. The colors and shapes of the symbols on the MDS plots indicate the species and brain region identities of the samples.

