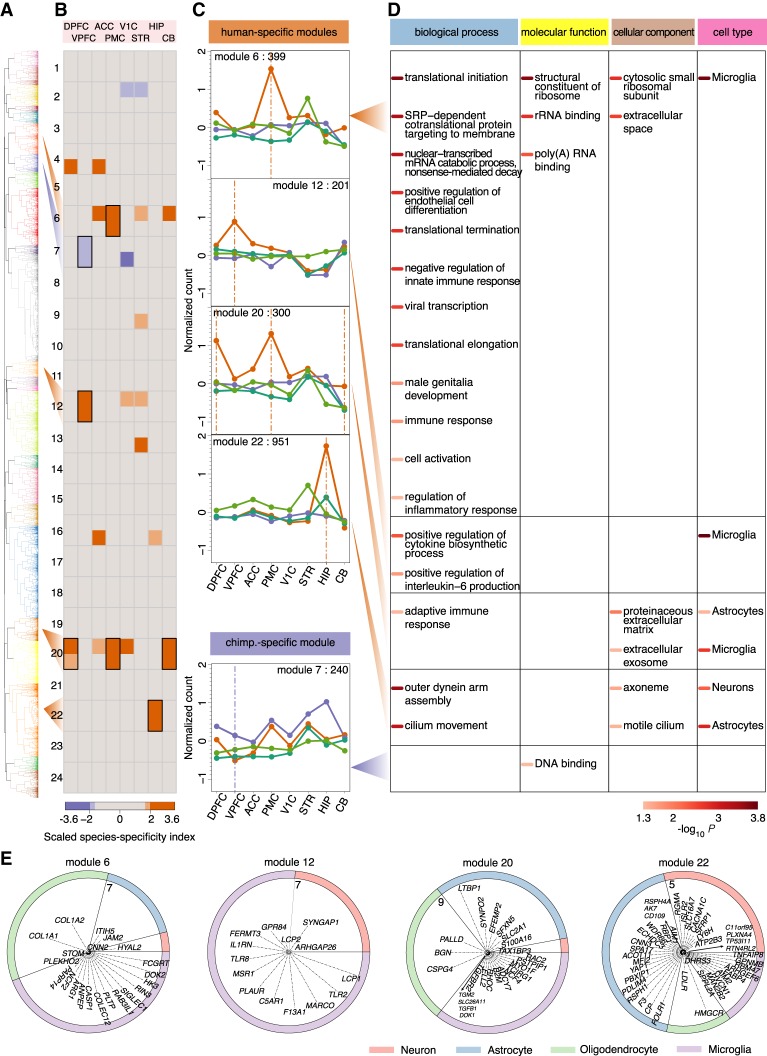
Figure 3.
Characteristics of species-specific coexpression modules. (A) Dendrogram based on unsupervised hierarchical clustering of expression profiles of 9726 genes with significant expression differences between humans and chimpanzees in at least one brain region. The colors indicate 24 identified modules. (B) The heat map shows scaled species-specificity indices calculated using gorilla (upper) and gibbon (lower) data for each module in each brain region: (top) each of the eight brain regions; (left) module labels. The colors indicate species-specificity based on Z-score thresholds corresponding to 5% and 10% cutoffs as indicated by the bar below: (orange) human-specific; (purple) chimpanzee-specific. The black rectangles indicate species-specific modules supported by both outgroup species. (C) Gene expression profiles of human-specific and chimpanzee-specific modules. The dots show normalized read counts averaged across genes within each module for respective species: (orange) humans; (purple) chimpanzees; (dark green) gorillas; (light green) gibbon. The label at the top of each panel shows the number of genes within the module. The vertical lines show brain regions showing significant species-specificity within the module. (D) The enrichment of genes in species-specific modules in three GO term categories and cell-type markers. The shade of the color bars beside the term and cell-type names indicates P-values of a hypergeometric test after BH correction, as shown by the bar below. (E) The distribution of cell-type marker genes within the four human-specific modules. Each ring represents one human-specific module, showing the relative proportions of neuronal, astrocytic, oligodendrocytic, and microglial marker genes within the module with expression human-specificity ratio greater than one, normalized to the overall number of marker genes for each cell type. The corresponding marker gene names are shown within the rings, with the distance between each gene and the center representing the log2-transformed human-specificity ratio. The numbers show the maximum of the log2-transformed human-specificity ratio range within the modules. The human-specificity ratio was calculated as the ratio of the absolute expression difference between humans and the outgroup species to the absolute difference between chimpanzees and the outgroup species.

