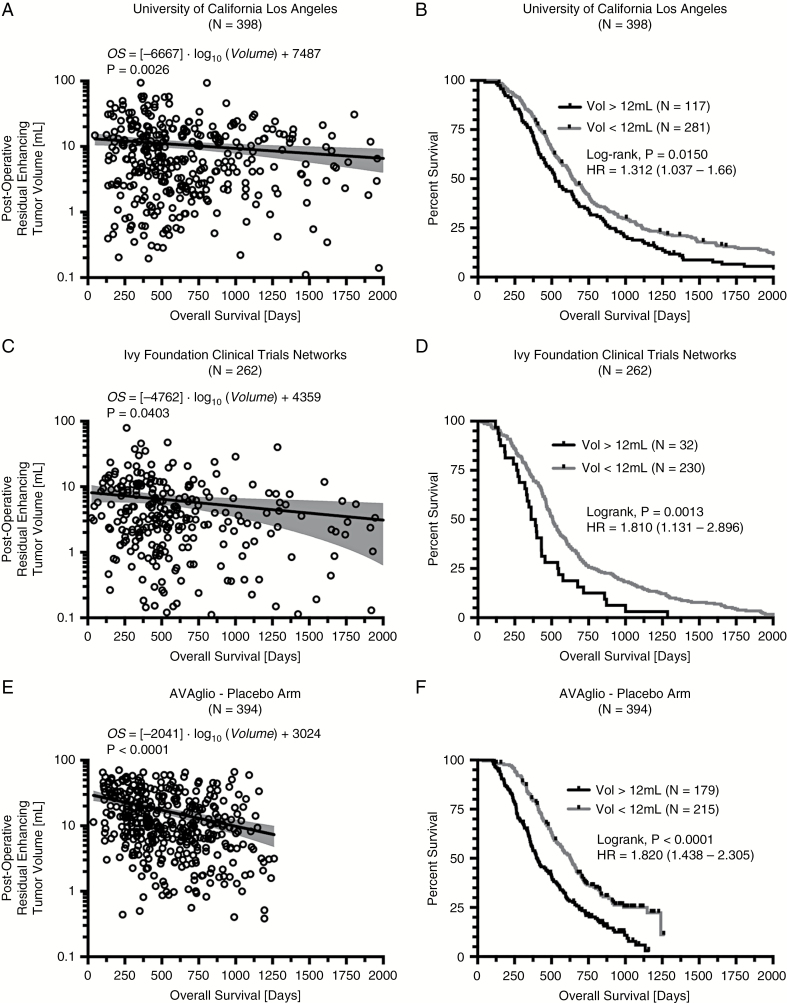
Fig. 2.
Log-linear correlation and survival analysis results for discovery, confirmation, and validation cohorts of newly diagnosed GBM treated with standard chemoradiation. (A) Log-linear correlation between postoperative tumor volume and OS in a single center cohort from the UCLA Neuro-Oncology Database (N = 398). (B) Kaplan–Meier survival plots demonstrating a survival advantage for patients with tumor volumes less than 12 mL, the mean volume of residual tumor from all chemoradiation only trials. (C) Log-linear correlation between postoperative tumor volume and OS in the Ivy Foundation Clinical Trials Network Radiogenomic Database (N = 262). (D) Kaplan–Meier survival plots confirming a survival advantage in patients with a small (<12 mL) residual enhancing tumor remaining following surgical resection. (E) Log-linear correlation between postoperative tumor volume and OS in the AVAglio placebo arm (N = 384). (F) Kaplan–Meier survival plots validating the survival advantage in patients with small (<12 mL) enhancing tumors. (G) Log-linear correlation in all patients treated with standard chemoradiation (N = 1054). (H) Kaplan–Meier survival plots showing increasingly longer OS with smaller tumors. (I) Plot of average enhancing tumor volume versus median OS for tumor volumes from 0 to 20 mL in increments of 5 mL.

