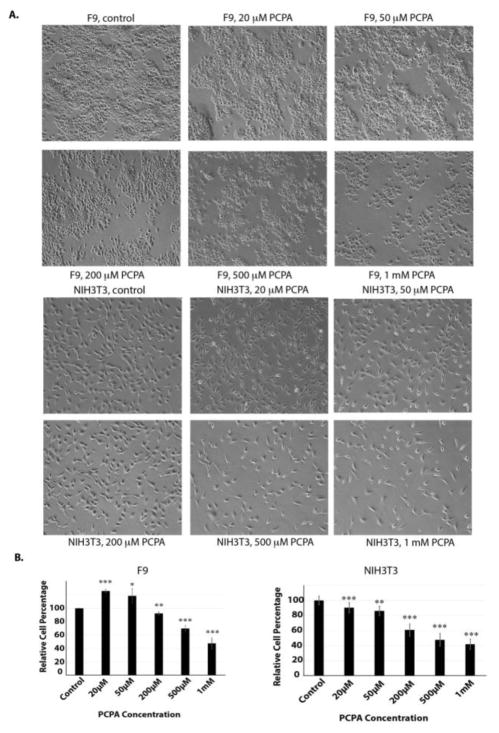
Figure 7.
Tranylcypromine inhibits the growth of both F9 and NIH3T3 cells.
A. In vivo effects of tranylcypromine on F9 and NIH3T3 cells. Actively growing F9 and NIH3T3 cells were treated with various concentrations of tranylcypromine (PCPA) for 16 hours and examined. Cells were examined and cells images were acquired as in Figure 3A. Triplicated cells (technical repeats) were used for examination and one set of representative treated cells was shown.
B. Triplicated treated cells (technical repeats) from Figure 7A were harvested by trypsin digestion, diluted, and blindly spotted onto a hemacytometer as in Figure 3B. The differences between control and tranylcypromine-treated cells in triplicated samples were plotted. Experiments were repeated for three independent times with the same conclusion and one example is shown. Statistically significant differences were determined using a two-tailed equal-variance independent t-test. Different data sets were considered to be statistically significant when the P-value was <0.05 (*), 0.01 (**) or 0.001 (***).

