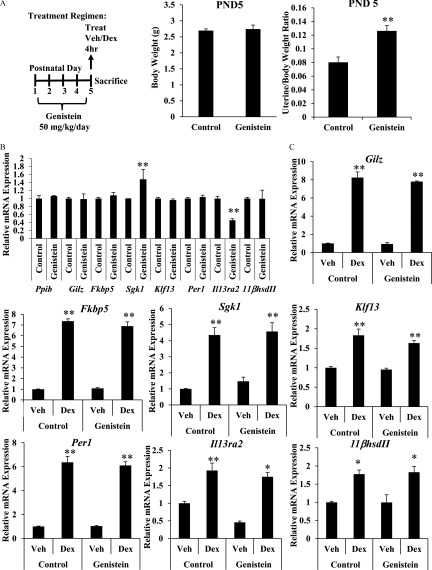
Figure 1.
Effect of neonatal genistein exposure on immediate glucocorticoid target gene expression. (A) Schematic representation of dosing schedule and experimental end points. Body and uterine weights (g) were determined on PND5 for control and genistein-treated mice. Data represent mean of . ** determined by Student’s t-test. (B and C) Relative mRNA expression of Ppib, Gilz, Fkbp5, Sgk1, Klf13, Per1, , and Il13ra2 as measured by qRT-PCR 4 h following subcutaneous injection of vehicle or Dex on PND5. (B) Basal gene expression was determined by comparing the vehicle-treated genistein group to vehicle-treated controls. (C) Fold change was determined by reporting values relative to vehicle-treated controls. Values are normalized to the reference gene peptidylprolyl isomerase B (Ppib). Bar graphs show the from 3 to 5 animals. ** as determined by ANOVA with Tukey’s post hoc analysis. Dex, dexamethasone; PND, postnatal day; qRT-PCR, quantitative real-time polymerase chain reaction; Treat, treatment; Veh, vehicle.

