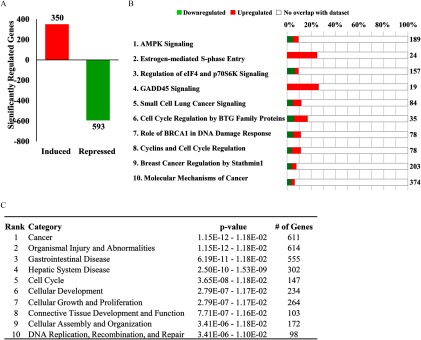
Figure 4.
Effect of neonatal genistein exposure on basal gene expression in the uterus. (A) Whole genome microarray analysis was performed on total RNA isolated from the uterus of adult ADX/OVX PND56 mice previously exposed to control or genistein. Three biological replicates were evaluated for each treatment group. The number of probes that were significantly different () between the control and genistein-exposed group were graphed as induced (red) or repressed (green). (B) Significantly different genes were evaluated in IPA software and the top 10 regulated canonical pathways are reported. The total number of genes in the IPA-annotated pathway is listed on the right side of the graph. The total percentage of significantly regulated genes is depicted as the sum of induced and repressed genes. (C) The top 10 diseases and biological functions are listed. The p-value range and number of genes within the listed functions is provided. ADX/OVX, adrenalectomized/ovariectomized; IPA, Ingenuity Pathway Analysis; PND, postnatal day.

