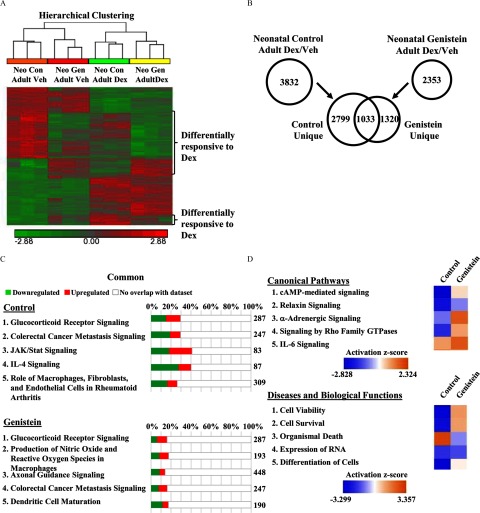
Figure 5.
Effect of genistein exposure on genome-wide regulation by glucocorticoids. (A) Adult ADX/OVX (PND56) mice, exposed as neonates to control or genistein, were treated with vehicle (saline) or Dex for 4 h. Whole genome microarray analysis was performed on total RNA isolated from the uterus, with three biological replicates evaluated for each treatment group. Heat map and hierarchical clustering of significantly regulated genes (), where red represents induced genes and green represents repressed genes. (B) The number of significantly regulated genes by treatment () were compared between the control and genistein groups by Venn diagram. (C) Significantly regulated genes were annotated with IPA software. The top five regulated canonical pathways are reported for the control and genistein groups. The total number of genes in the IPA-annotated pathway is listed on the right side of the graph. The total percentage of significantly regulated genes is depicted as the sum of induced and repressed genes. (D) Genes uniquely regulated by Dex in the control (2,799) and genistein (1,320) groups. The top five canonical pathways and diseases and biological functions were ranked and assigned an activation z-score (orange indicates induced; blue indicates repressed). ADX/OVX, adrenalectomized/ovariectomized; Con, control; Dex, dexamethasone; IPA, Ingenuity Pathway Analysis; Neo, neonatal; Veh, vehicle.

