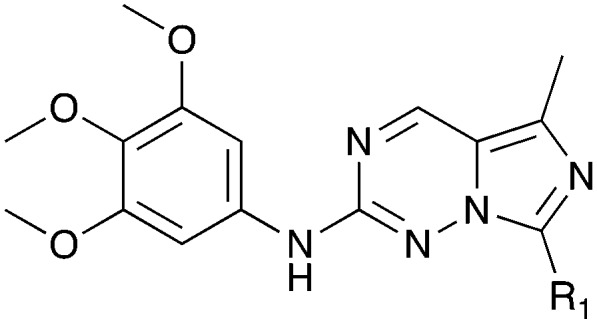
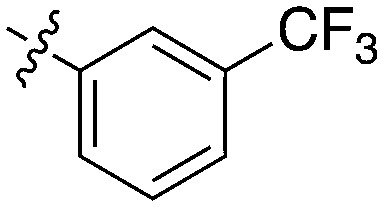
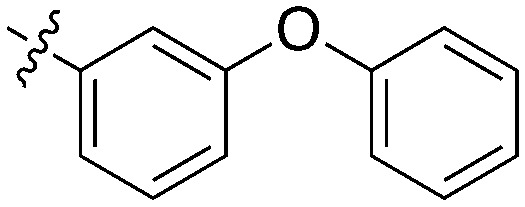
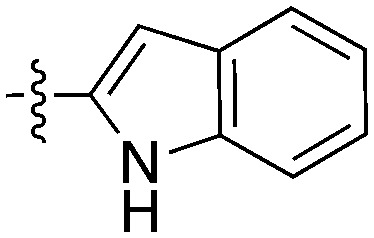
Table 12. Imidazotriazine structures and percent inhibition values.

| ||||||||||||
| Compound | R 1 | # kinases ≥90% Inh | Nek1 | Nek2 | Nek3 | Nek4 | Nek5 | Nek6 | Nek7 | Nek9 | Nek10 | Nek11 |
| % Inhibition (a. 1 μM b. 100 nM) | ||||||||||||
| GW7331 a |

|
0 | a. 22% | a. 38% | — | — | — | a. 9% | a. 10% | a. 86% | — | — |
| b. 5% | b. 8% | b. 4% | b. 6% | b. 55% | ||||||||
| GW1893 a |

|
0 | a. 11% | a. 32% | — | — | — | a. 81% | a. 2% | a. –1% | — | — |
| b. 3% | b. 7% | b. 29% | b. 4% | b. 3% | ||||||||
| UNC5391 b |

|
0 | a. 16% | a. 70% | a. 89% | a. 41% | a. 99% | a. 70% | a. 70% | a. 70% | a. 0% | a. 86% |
| b. — | b. — | b. — | b. — | b. — | b. — | b. — | b. — | b. — | b. — | |||
a PKIS – Nanosyn screening data (Ellkins et al., 2016).
b PKIS2 – DiscoverX screening data (Drewry et al., 2017).
