. 2018 Apr 18;126(4):047008. doi: 10.1289/EHP1943

Figure 4.

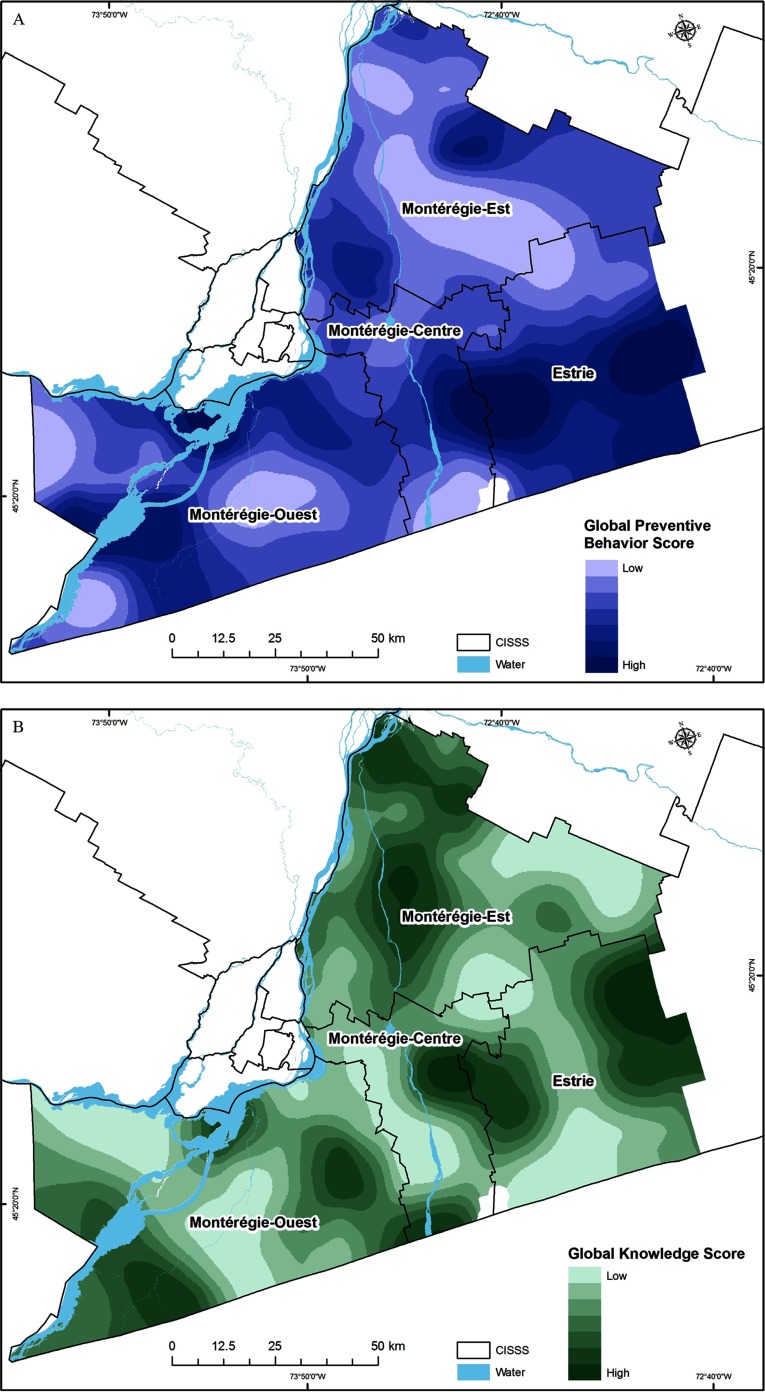
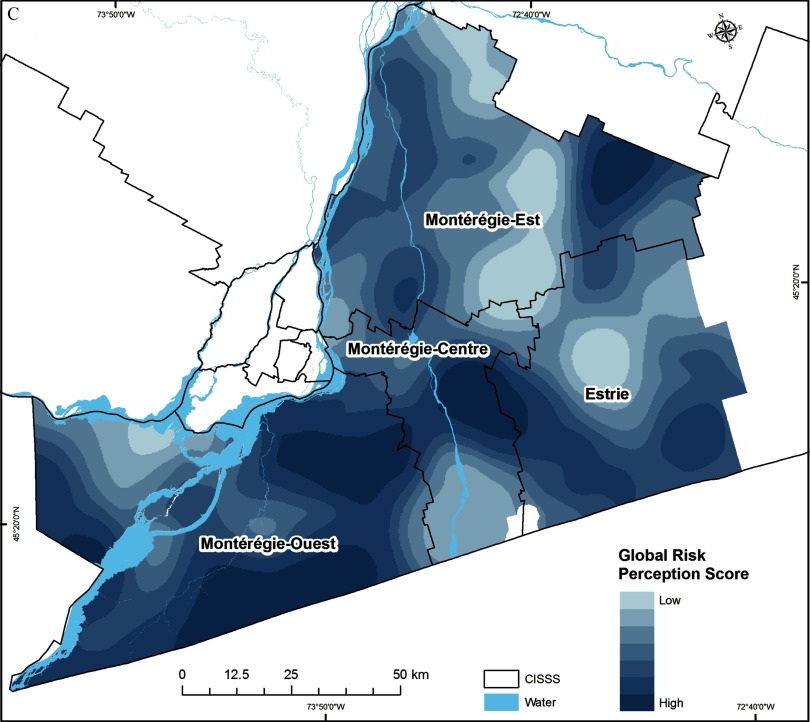
Figures 4A, 4B, and 4C are maps marking the locations in terms of the global preventive behavior score, global knowledge score, and global risk perception score, respectively, based on CISSS and water.

Figures 4A, 4B, and 4C are maps marking the locations in terms of the global preventive behavior score, global knowledge score, and global risk perception score, respectively, based on CISSS and water.

Spatial variation in the level of (A) adoption of individual preventive behaviors (i.e., global preventive behavior score; GPB); (B) knowledge about the disease (i.e., global knowledge score; GK); and (C) risk perceptions (i.e., global risk perception score; GRP). Darker areas represent higher index scores for these social-behavioral drivers but a lower risk for Lyme disease risk transmission.