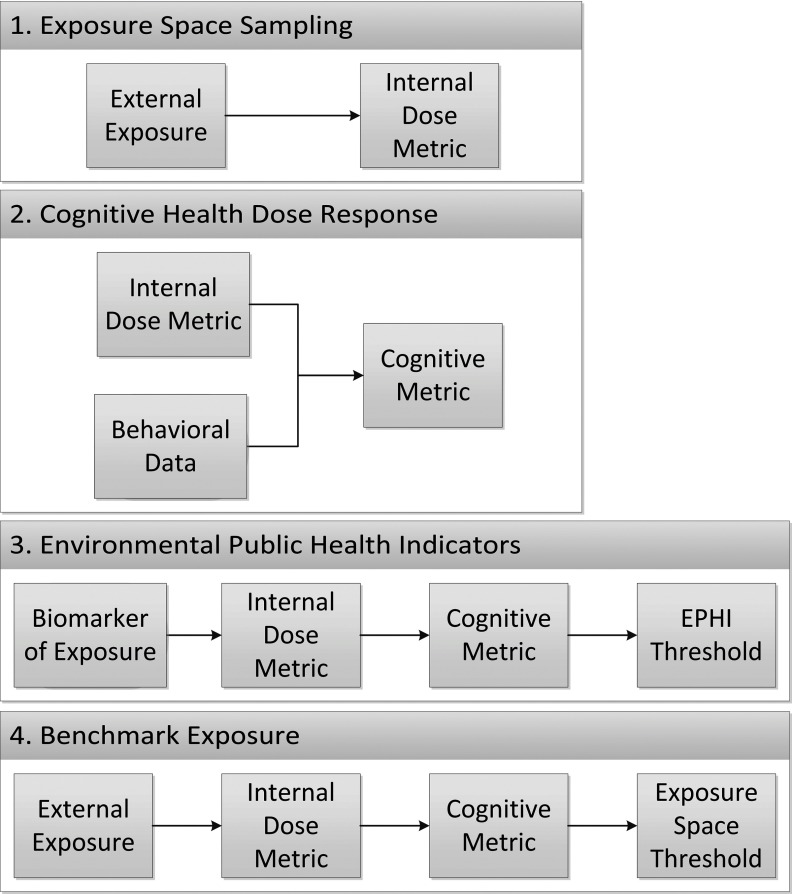
Figure 2.
Outline of the required inputs for each step of the proposed methodology for determining Environmental Public Health Indicators (EPHIs) and Exposure Space Thresholds. The cognitive metric represents the predicted neurobehavioral deficit using data from the animal study. The EPHI threshold represents the biomarker of exposure corresponding to a defined change in the cognitive metric, and the exposure space threshold represents the external exposure conditions giving rise to that same change in cognitive metric. The values for “Behavioral Data” and “Biomarker of Exposure” are measured values from published neurobehavioral and biomonitoring studies, respectively.

