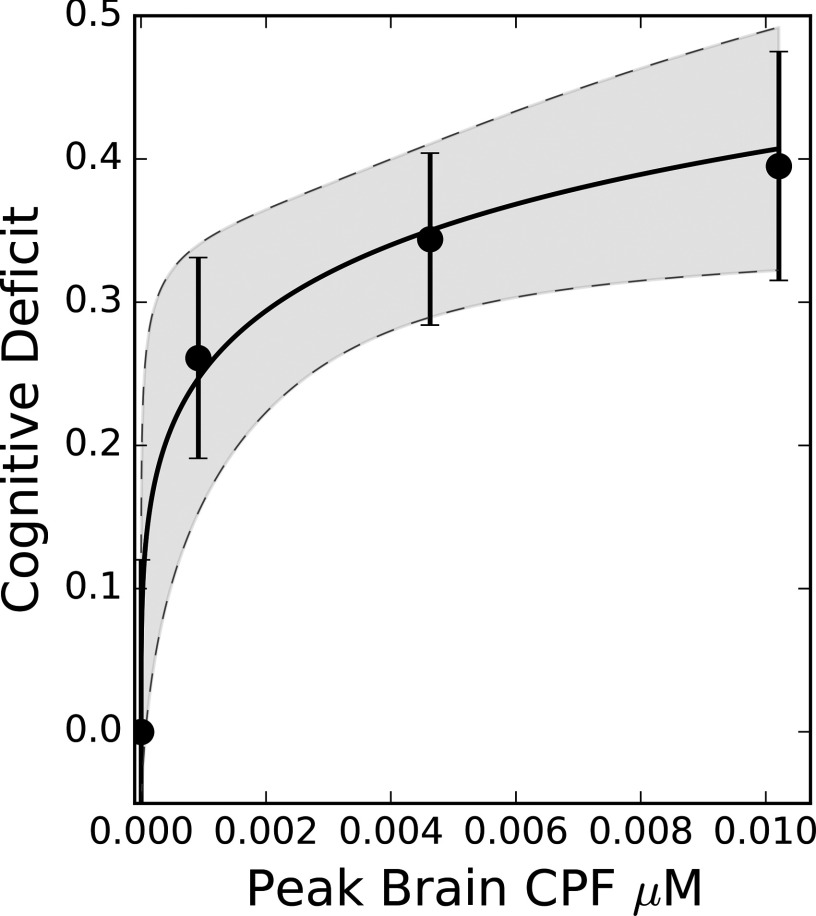
Figure 3.
Dose–response curve for spatial memory fractional deficit corresponding to a chlorpyrifos (CPF)-induced change in Morris water maze latency to platform. Solid and dashed lines represent the mean and 95% prediction intervals, respectively. Circles represent reported fractional change in Morris water maze latency to platform for the exposed groups (Yan et al. 2012). Peak CPF concentrations for these data are the values predicted from the physiologically based pharmacokinetic (PBPK)/pharmacodynamic (PD) model based on the reported once daily oral gavage exposures of 1, 5, and .

