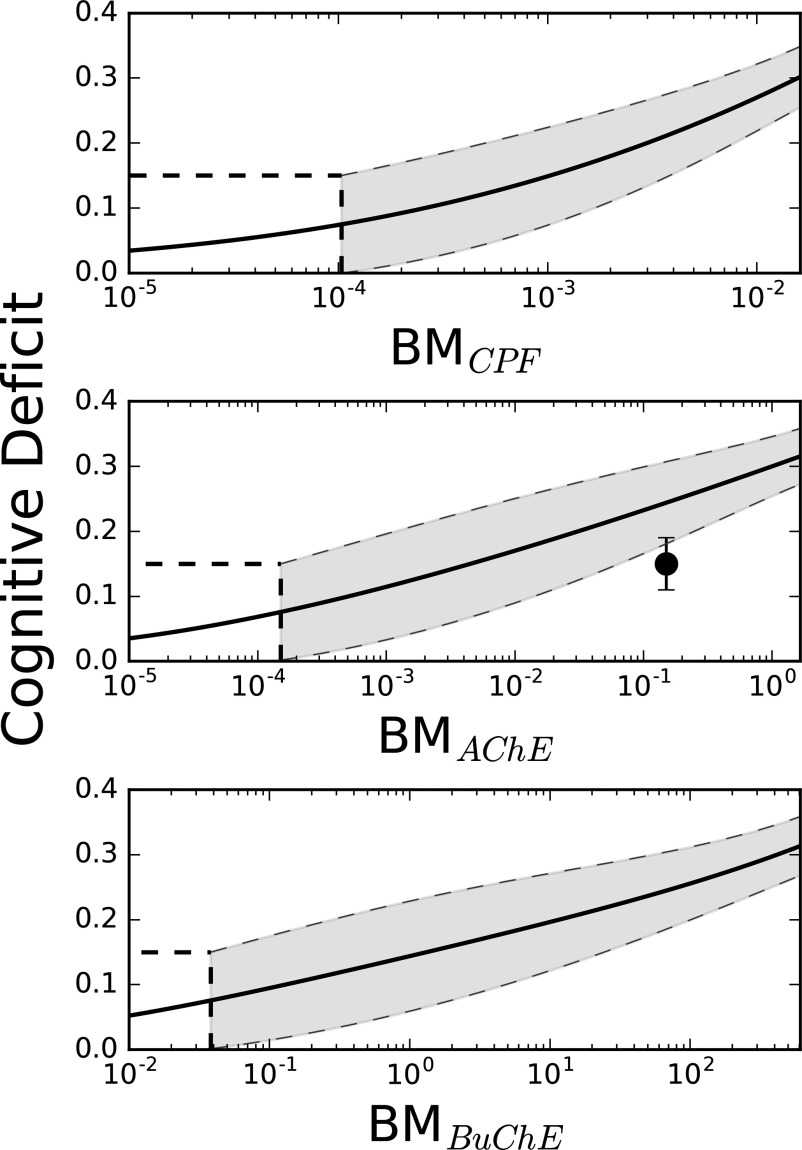
Figure 5.
Predictions of human-specific cognitive deficits from measurable biomarkers of exposure. , , and , are the independent biomarker of exposure variables for Equation 2 and correspond to peak plasma chlorpyrifos (CPF) concentration, minimum blood acetylcholinesterase (AChE) inhibition and minimum blood butyrylcholinesterase (BuChE) inhibition, respectively. Dashed lines represent 95% prediction intervals, and the solid circle (•) represents measured fractional cognitive deficit data from Farahat et al. (2003) using the differences in performance of the Benton Visual Retention Test between the exposed and unexposed groups and fractional plasma AChE activity from the reported plasma AChE activity.

