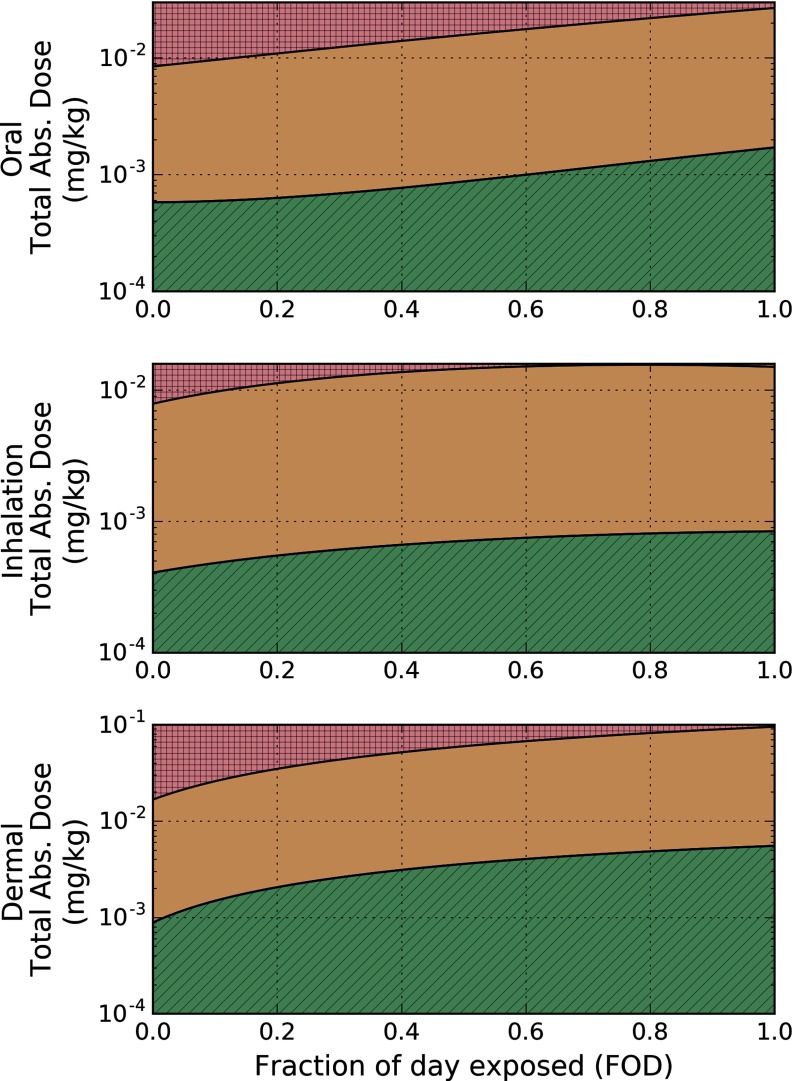
Figure 7.
External exposure space using the preliminary benchmark dose giving rise to a 15% cognitive deficit () and lower limit benchmark dose giving rise to a 15% cognitive deficit ()for humans. Boundaries for the and were derived from Equation 4 when the external exposure scenario gives rise to a chlorpyrifos (CPF) brain concentration at the proposed and in the human. Fraction of day exposed (FOD) represents how much of the day a human is exposed to the total applied dose (TAD). Red (square hatching), orange (no hatching), and green (diagonal hatching) shading indicate exposure scenarios that fall above the , between the and the , and below the , respectively.

