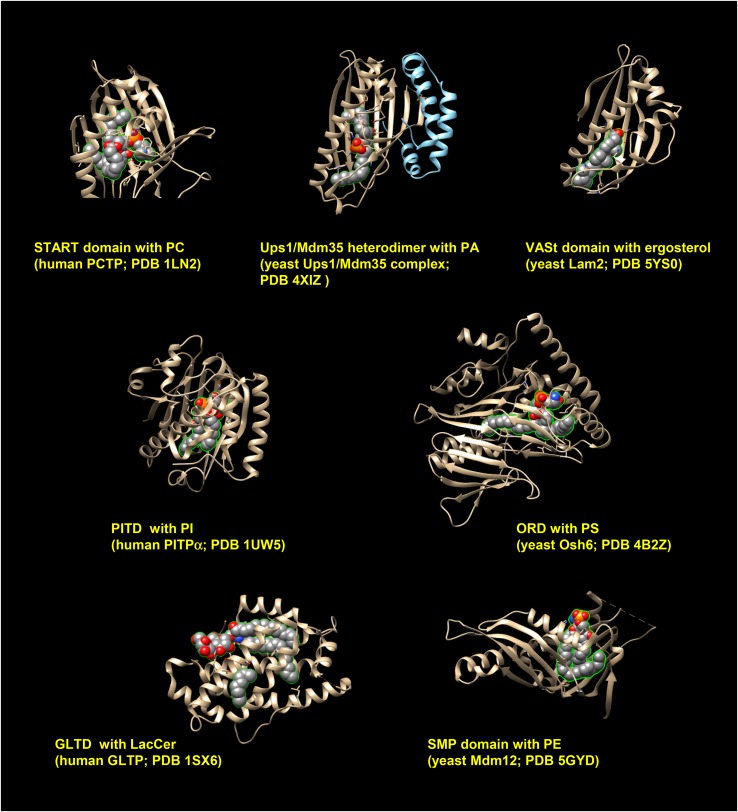
Fig. 4.
The 3D structures of lipid-enclosed LTDs. X-ray crystallography data of indicated LTDs in complex with lipid ligands was obtained from the RCSB protein database (Protein Data Bank; https://www.rcsb.org/). With the UCSF Chimera program (version 1.12) (225), proteins with ligands were three-dimensionally viewed. Lipid ligands are shown as the sphere model, in which gray, red, orange, and blue spheres represent carbon, oxygen, phosphorus, and nitrogen, respectively. PITD, PI-transfer domain; GLTD, glycolipid-transfer domain; LacCer, lactosylceramide.

