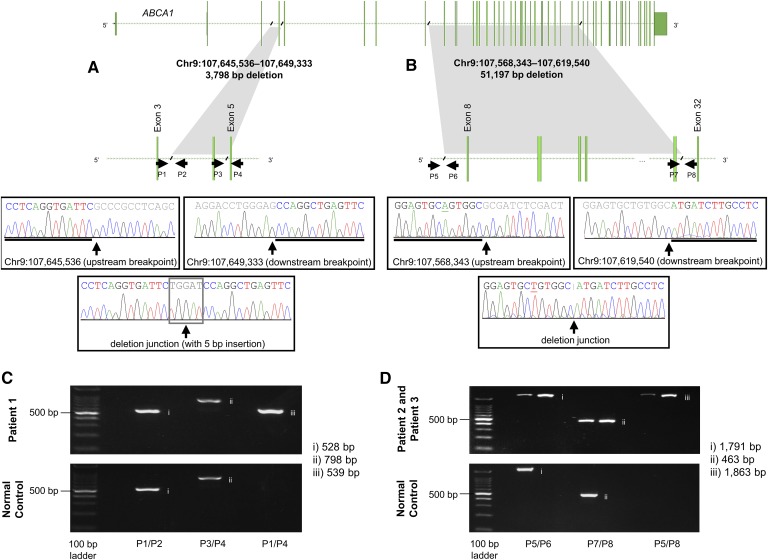
Fig. 2.
Validation of the partial gene deletions of ABCA1 in Patients 1, 2, and 3 with hypoalphalipoproteinemia. Sanger sequencing results for the reverse strand across upstream and downstream breakpoints, and the deletion junctions for Patient 1 (A) and Patients 2 and 3 (B). Underlined bases represent polymorphic sites between subjects. The black slashes indicate the sequence breakpoints, while the arrows demonstrate the position and orientation of primers used in breakpoint identification and Sanger sequencing. The gene transcript image was taken and modified from Chromosome Analysis Suite and VarSeq®. Gel electrophoresis of PCR products across upstream and downstream breakpoints, and deletion junctions for Patient 1 (C) and Patients 2 and 3 (D). Results from each patient are presented on the top, with results from a normal control on the bottom. Lane 1 contains 100bp ladder, lane 2 contains products across the upstream breakpoint, lane 3 contains products across the downstream breakpoint, and lane 4 contains products across the deletion junction. chr, chromosome; P, primer.

