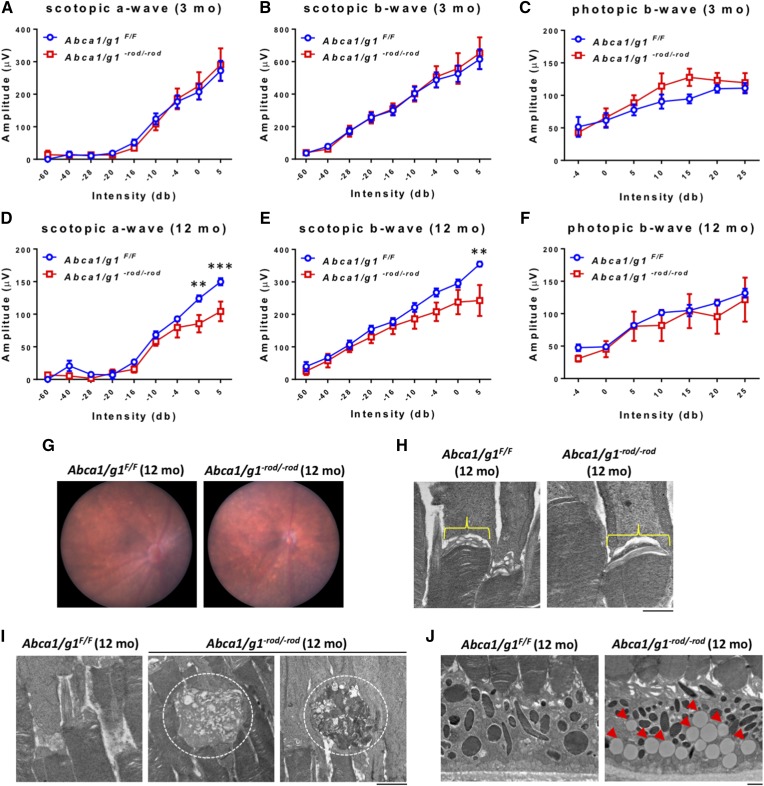
Fig. 1.
Aged (12 months) Abca1/g1−rod/−rod mouse retinas show decreased scotopic responses and accumulation of lipids. A–C: ERG of 3-month-old Abca1/g1F/F and Abca1/g1−rod/−rod mice. Abca1/g1F/F (blue circles), n = 7; Abca1/g1−rod/−rod (red squares), n = 5. A: Scotopic a-wave amplitude. B: Scotopic b-wave amplitude. C: Photopic b-wave amplitude. No significant difference was detected by two-way ANOVA. D–F: ERG of 12-month-old Abca1/g1F/F and Abca1/g1−rod/−rod mice. Abca1/g1F/F (blue squares), n = 5; Abca1/g1−rod/−rod (red squares), n = 5. D: Scotopic a-wave amplitude. E: Scotopic b-wave amplitude. F: Photopic b-wave amplitude. **P < 0.01 and ***P < 0.001 by two-way ANOVA with post hoc Bonferroni’s multiple comparison test. G: Representative fundus images of 12-month-old Abca1/g1F/F and Abca1/g1−rod/−rod mouse retinas. H, I: Representative electron microscopy images of 12-month-old Abca1/g1F/F and Abca1/g1−rod/−rod mouse retinas. Scale bar: 1 μm. H: Attenuation of vesicular structures at the rod inner and outer segment in Abca1/g1−rod/−rod mouse retinas. I: Dysmorphic change of outer segments of Abca1/g1−rod/−rod mouse retinas (dashed circle). J: Accumulation of large lipid droplets within the RPE (red arrowheads). Values are mean ± SE.

