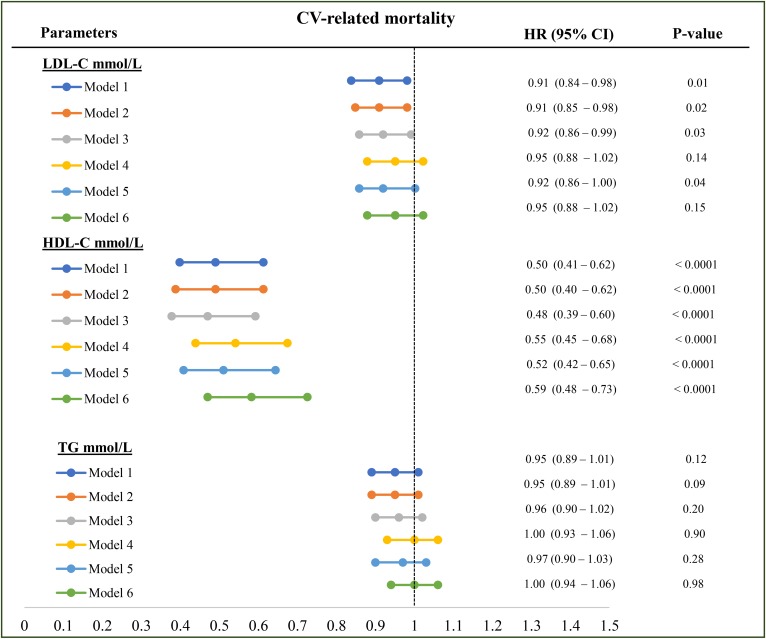
Fig. 3.
Association between each lipoprotein and CV-related mortality. Model 1: LDL-C or HDL-C or TG plus age, vintage, gender, vascular access, BMI, regions; model 2: model 1 plus diabetes; model 3: model 2 plus serum creatinine level; model 4: model 3 plus serum albumin level; model 5: model 3 plus serum CRP; model 6: model 3 plus serum albumin, CRP, and NLR level. All the analyses were performed by Cox proportional model with time-varying covariates. HRs are reported as per mmol/l.

