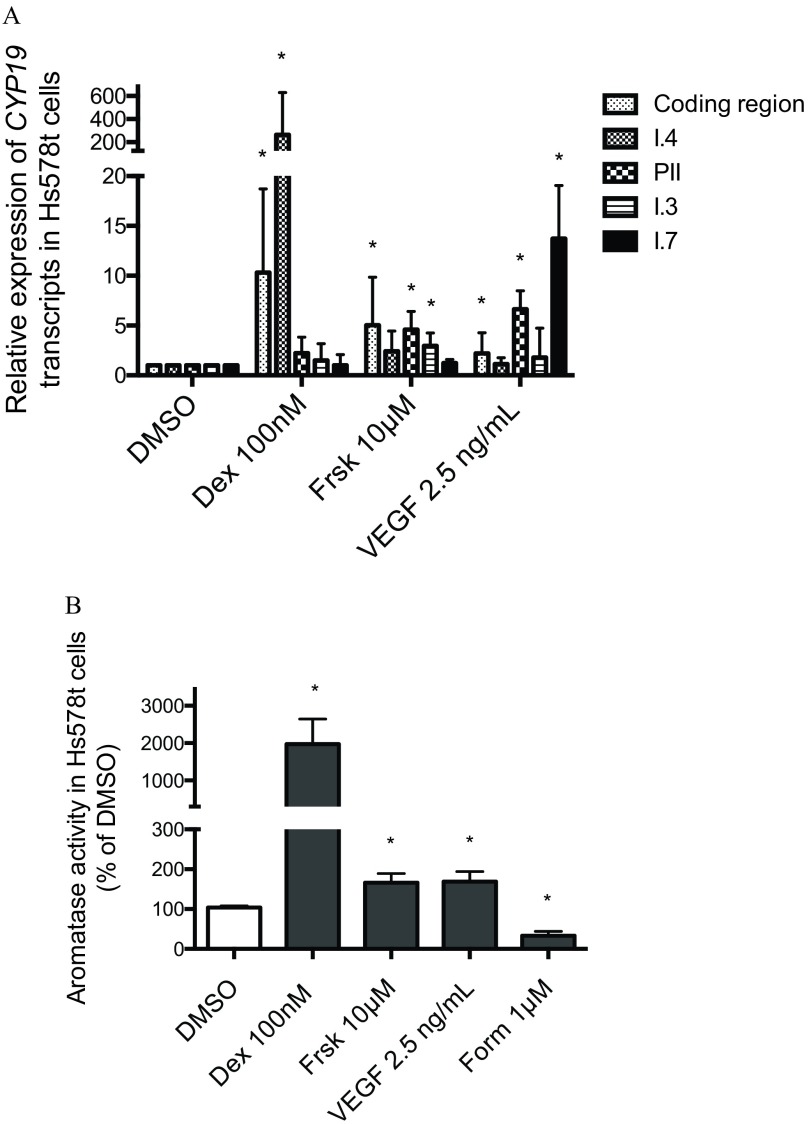
Figure 1.
(A) Relative expression of CYP19 coding region (nonpromoter-specific or total), and I.4, PII, I.3, and I.7 promoter-derived CYP19 transcripts in Hs578t cells (fold DMSO control). (B) Aromatase catalytic activity in Hs578t cells exposed to dexamethasone (DEX) , forskolin (Frsk) , vascular endothelial growth factor (VEGF) , or formestane (Form) . Experiments were performed in triplicate with three different cell passages; per experiment, each treatment was tested in triplicate. Cells were exposed to treatments for 24 h. *, . Statistically significant difference between treatments compared with DMSO (Student t-test).

