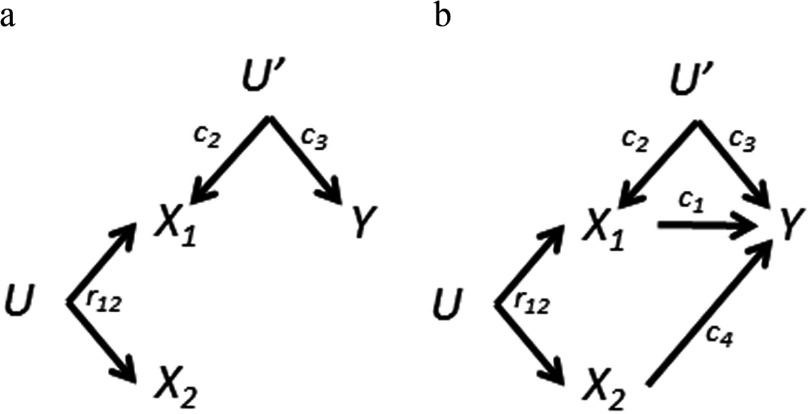
Figure 3.
Variations of the directed acyclic graph (DAG) in Figure 2a: differences in causation by exposures. a) Neither nor causes Y. Bias amplification still occurs. is the bivariate correlation coefficient for and . b) Both exposures cause the outcome. Here there is no optimal solution: Both single-exposure and mutually adjusted regression coefficients are biased.

