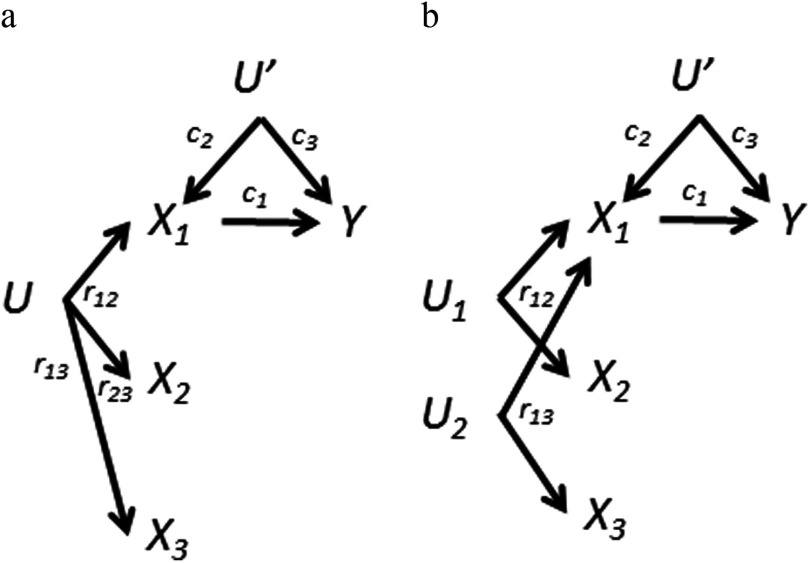
Figure 4.
Variations of the directed acyclic graph (DAG) in Figure 2a: three exposures. Bivariate correlations between exposures are for , for , and for . a) Assume all three exposures are (positively) correlated due to causation by the same source. b) There are two different sources and no correlation between and : . This simplifies the bias equations. In both cases, the bias amplification for the association caused by adjusting for one other exposure ( or ) will be further amplified when adjusting for all three. This is also true for the and associations for 4b.

