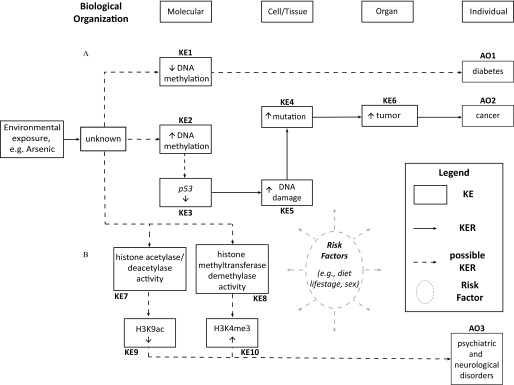
Figure 1.
Putative Adverse Outcome Pathway (AOP) network for arsenic exposure. (A) Changes in DNA methylation leading to cancer and (B) changes in histone modifications leading to psychiatric and neurological disorders. The gray oval and gray dashed lines indicate modifying factors or “risk” factors, all dashed lines for weak weight of evidence or areas where there are data gaps. The up and down arrows within a key event (KE) box indicate the direction of change of a KE. Note: AO, adverse outcome; KER, key event relationship.

