. 2018 Mar 6;126(3):037002. doi: 10.1289/EHP2223

Figure 3.

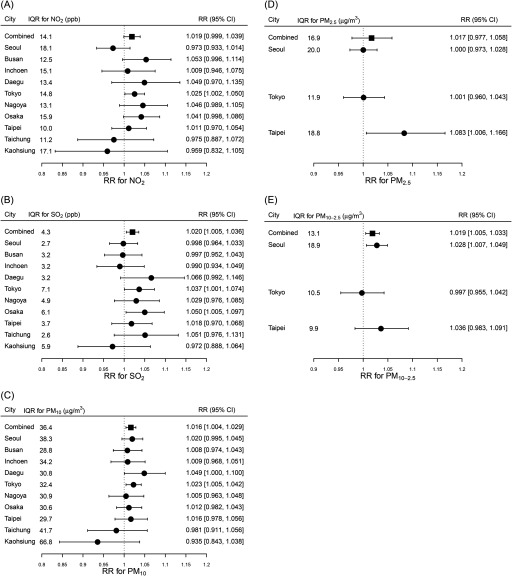
Figures 3A, 3B, 3C, 3D, and 3E are forest plots indicating interquartile range and relative risks (RRs) with 95 percent confidence intervals for the concentrations of N O sub 2 (parts per billion; scale: 0.8 to 1.2), S O sub 2 (parts per billion; scale: 0.8 to 1.2), PM sub 10 (micrograms per cubic meter; scale: 0.8 to 1.2), PM sub 2.5 (micrograms per cubic meter; scale: 0.9 to 1.2), and PM sub 10 to 2.5 (micrograms per cubic meter; scale: 0.9 to 1.2), respectively, for all cities combined and for Seoul, Busan, Incheon, Daegu, Tokyo, Nagoya, Osaka, Taipei, Taichung, and Kaohsiung.

Interquartile range (IQR), combined and city-specific relative risks (RRs), and 95% confidence intervals of suicide per IQR increase in the average 0–1 d concentration of (A) nitrogen dioxide (NO2), (B) sulfur dioxide (SO2), (C) particulate matter with aerodynamic diameter 10μm (PM10), (D) particulate matter with aerodynamic diameter 2.5μm (PM2.5), and (E) coarse particulate matter (PM102.5) after adjusting for potential confounders (i.e., ambient temperature, sunshine duration, day-of-week, public holiday, seasonality, and long-term time trend) in single-pollutant models.