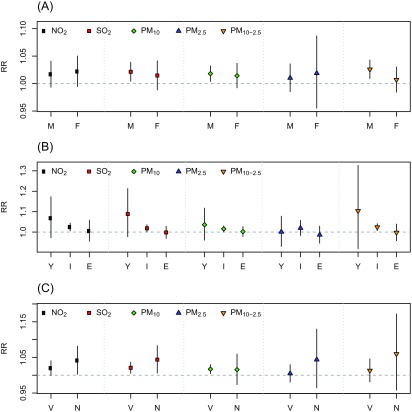
Figure 4.
Combined relative risks (RRs) and 95% confidence intervals of suicide stratified by (A) sex (M, males; F, females), (B) age groups (Y, 10–24 y; I, 25–64 y; E, ), and (C) method of suicide (V, violent suicide; N, nonviolent suicide) per interquartile range increase in the average 0–1 d concentration of nitrogen dioxide (), sulfur dioxide (), particulate matter with aerodynamic diameter ; (), particulate matter with aerodynamic diameter (), and coarse particulate matter () after adjusting for potential confounders (i.e., ambient temperature, sunshine duration, day-of-week, public holiday, seasonality, and long-term time trend) in single-pollutant models.

