
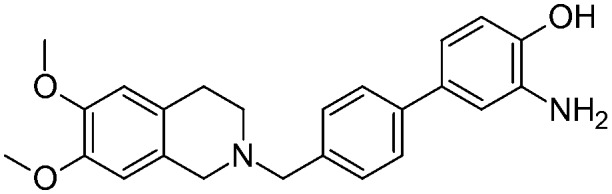
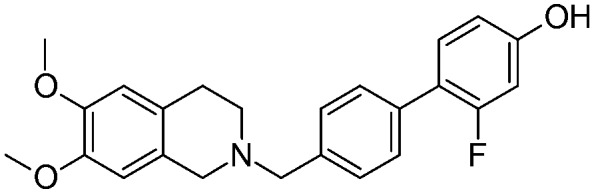
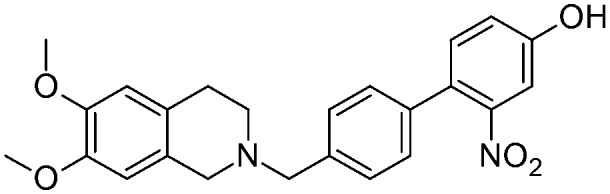
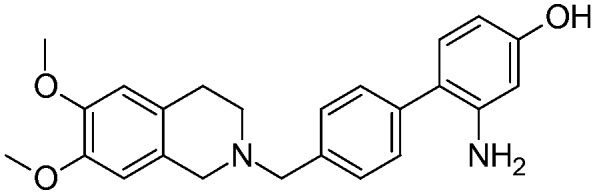
Table 1. Biological characterization of target compounds.
| Compound | Structure | MDR1 EC50 a (μM) | MRP1 EC50 a (μM) | BCRP EC50 a (μM) | ATP consumption | P app b |
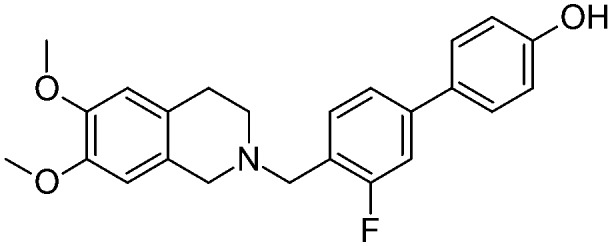
| 5a |

|
1.60 ± 0.27 | na c | na | NO d | 4.5 |
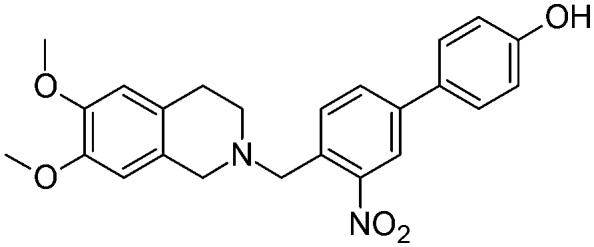
| 5b |
|
4.73 ± 0.90 | na | na | NO | 4.1 |
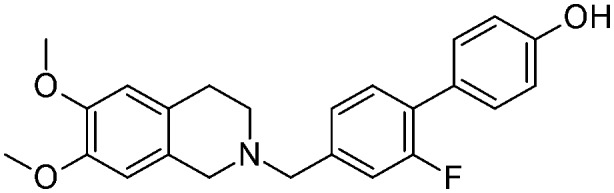
| 5c |
|
8.4 ± 1.58 | na | na | NO | 5.8 |
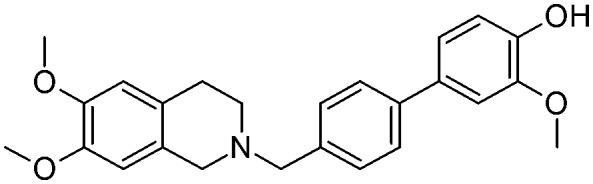
| 5d |

|
1.51 ± 0.30 | 38 ± 7.6 | na | NO | 4.4 |
| 5e |
|
6.2 ± 1.24 | na | na | NO | 3.7 |
| 5f |

|
15.2 ± 3.00 | na | na | NO | 2.9 |
| 12a |
|
2.0 ± 0.40 | na | na | NO | 3.9 |
| 12b |

|
2.8 ± 0.56 | na | na | NO | 4.9 |
| 12c |

|
12.7 ± 2.50 | 28.9 | na | NO | 6.3 |
| 17a |
|
6.9 ± 1.32 | na | na | NO | 7.5 |
| 12d |

|
1.86 ± 0.37 | 62 | na | NO | 3.5 |
| 12e |
|
2.17 ± 0.43 | na | na | NO | 4.5 |
| 16 |
|
2.54 ± 0.48 | na | na | NO | 11.2 |
| 17b |
|
5.4 ± 1.00 | na | na | NO | 4.5 |
| MC70 |

|
0.69 | 9.30 | 73 | NO | 1.3 |
aThe values are the means of three independent experiments; samples analyzed in duplicate.
bThe apparent permeability was determined as the BA/AB ratio (the values are from two independent experiments).
cNot active at 100 μM.
dNo significant ATP consumption at the activity doses.