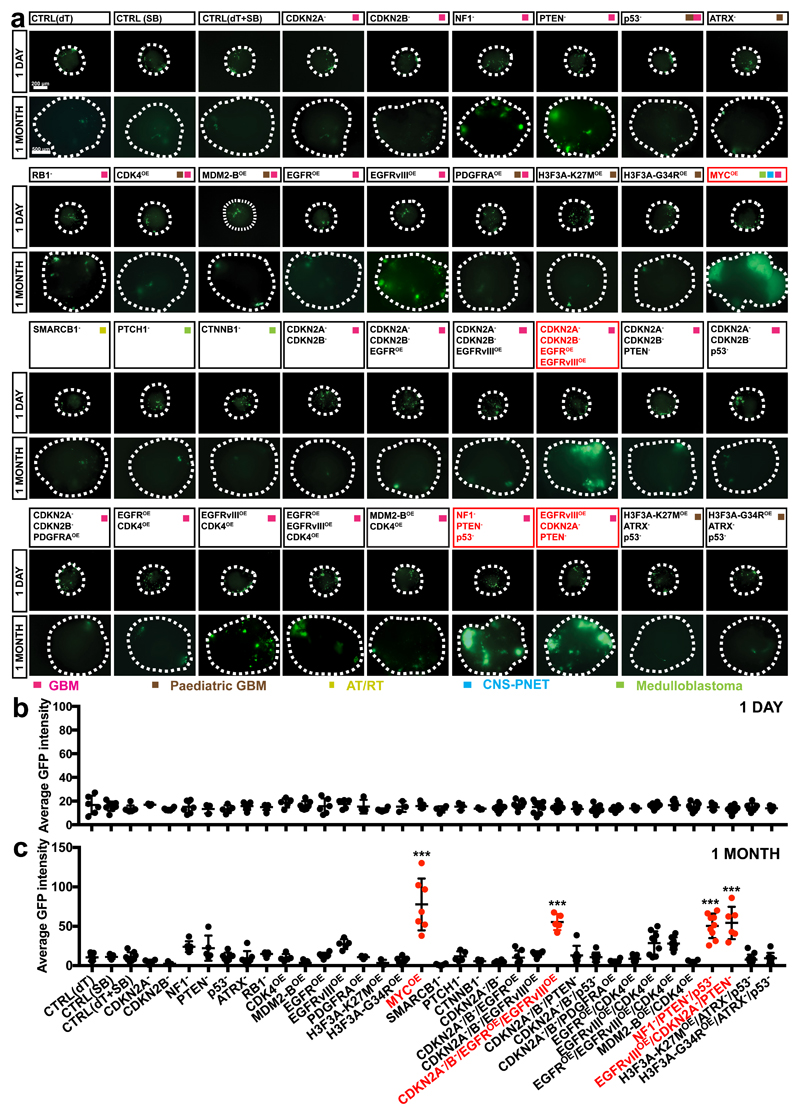
Figure 2. Clonal mutagenesis in organoids induces tumor overgrowth.
(a-c) Immunofluorescence images (a) and quantification of the GFP fluorescence intensity (b,c) of organoids mutagenized with the indicated mutation combinations 1 day (b) and 1 month (c) after nucleofection. Organoids from four groups exhibited significant overgrowth at one month: MYCOE (n=7; adjusted p<0.0001 v.s. CTRL(SB)), CDKN2A-/CDKN2B-/EGFROE/EGFRvIIIOE (n=5; adjusted p<0.0001 v.s. CTRL(dT+SB)), NF1-/PTEN-/p53- (n=9; adjusted p<0.0001 v.s. CTRL(dT+SB)), EGFRvIII/PTEN-/CDK2A- (n=6; adjusted p<0.0001 v.s. CTRL(dT+SB)). This experiment was performed once. Statistical analysis was performed using one-way ANOVA with Tukey’s test. Data are presented as mean±SD; full details including all sample sizes are provided Source Data. ***, p<0.001. Scale bar: a, 1 day: 200 μm; 1 month: 500 μm.

