. 2016 Oct 20;8(1):103–111. doi: 10.1039/c6md00501b

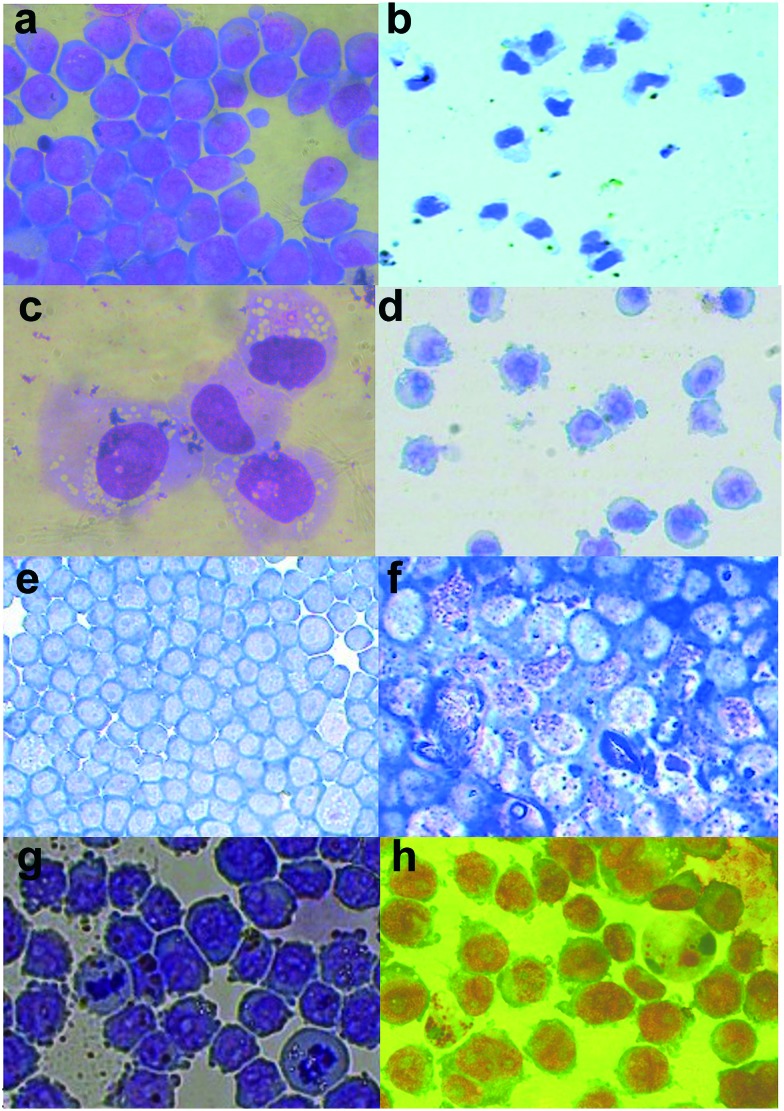
Fig. 4. Morphology of HL-60 cells upon exposure to (chalcogen)semicarbazones and corresponding complexes. Images are at 40× magnification. Plates a, b and c show the undifferentiated cells, and high power close ups of positive control differentiating agents, with DMSO day 5 differentiated (showing polymorphonuclear shaped nuclei) and PMA day 3 differentiated (showing more condensed nuclei and marked vacuolation), respectively. Plates d, f and h show H8qaSC (1 μM) at day 3, H8qaSeSC (10 μM) at day 3 and complex 3 (10 μM) at day 5, respectively, showing varying morphological evidence of differentiation. On the other hand, exposure to H8qaTSC (10 μM) at day 3 (plate e) and complex 1 (10 μM) at day 3 (plate g) show little change from the undifferentiated state.

Fig. 4