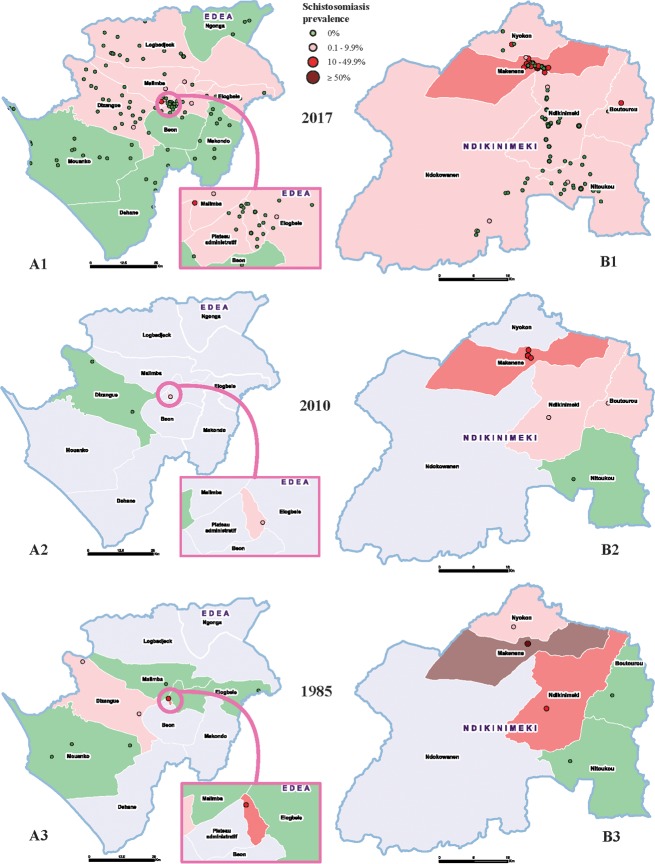
Fig 1.
Comparison of precision and conventional maps of schistosomiasis prevalence in the health districts of Edea (A) and Ndikinimeki (B), Cameroon. The precision maps (A1 and B1) provide more accurate information on the distribution of schistosomiasis within districts and a clear precision on subdistricts or communities requiring preventive chemotherapy. Differences of subdistrict prevalence between 1985 and 2010 mappings further illustrate the limitations and uncertainties of the conventional mapping (A2 versus A3 and B2 versus B3). Produced with Esri ArcGIS Pro 2.0.

