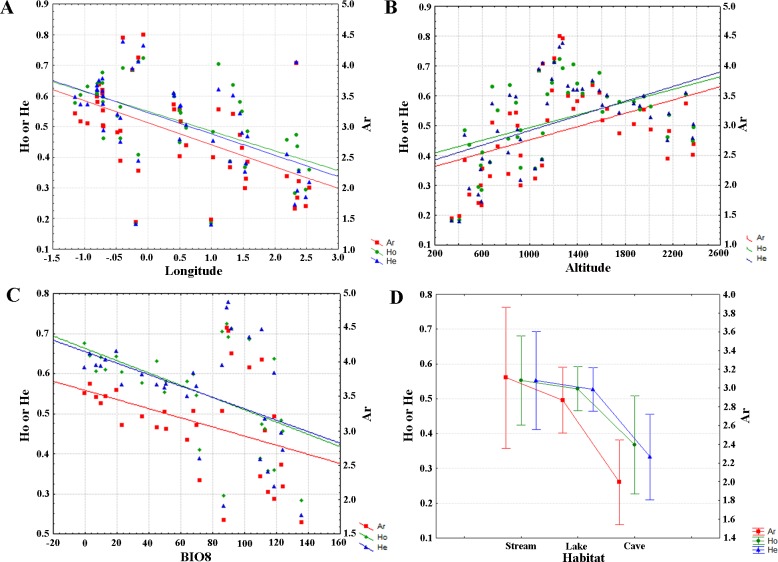
Fig 3. Linear regressions between the genetic diversity across the selected environmental and geographical variables.
Linear regressions between the three genetic diversity indices (Ar, HO and HE) across the longitude (A) and altitude (B) ranges, variable BIO8 (C) and the three distinct habitat types (D) of Calotriton asper populations.

