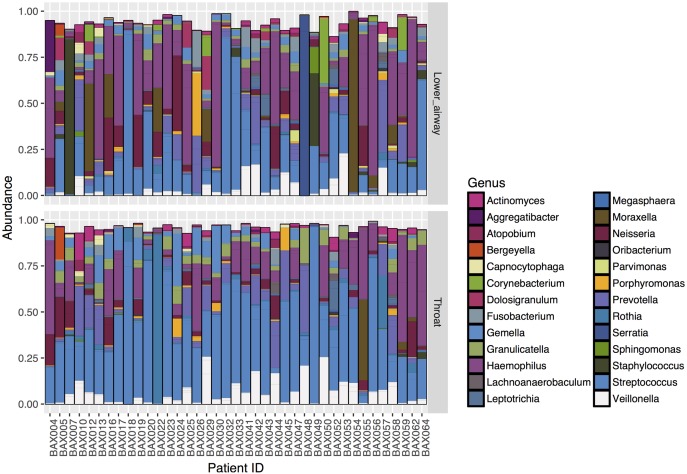
Fig 3. Individual patient barplots (N = 39) comparing paired lower airway samples and TS for the 50 most common OTUs.
The relative abundance of OTUs for each sample is shown with TS below and their corresponding lower airway sample above. Bars are of uneven heights due to the presence of low abundance “other” OTUs which have not been included in the plot. This illustrates that the airway microbiota is highly individual with variable degrees of similarity between TS and lower airway samples.

