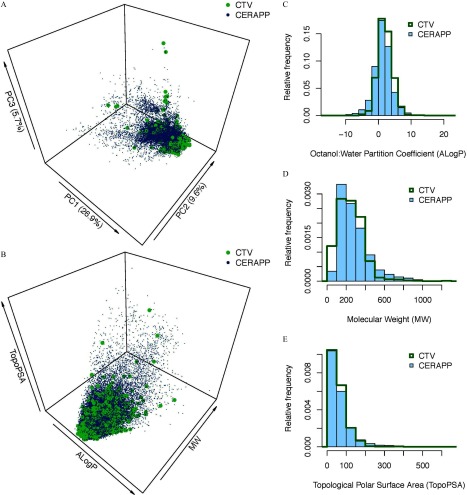
Figure 1.
Chemical space coverage of 886 Conditional toxicity value (CTV) chemicals compared to 32,464 structures in the Collaborative Estrogen Receptor Activity Prediction Project (CERAPP) “prediction” data set, based on chemical descriptors generated from the Chemistry Development Kit (CDK). (A) Three-dimensional (3-D) plot of coverage comparison based on first three principal components (PC); (B–E) Coverage comparisons based on easily interpretable descriptors octanol:water partition coefficient (ALogP), molecular weight (MW), and topological polar surface area (TopoPSA). Panel (B) is a 3-D plot, and panels (C–E) are histograms comparing the distribution of compounds for each descriptor. The 3-D plots were created in R (version 3.3.2; R Core Team).

