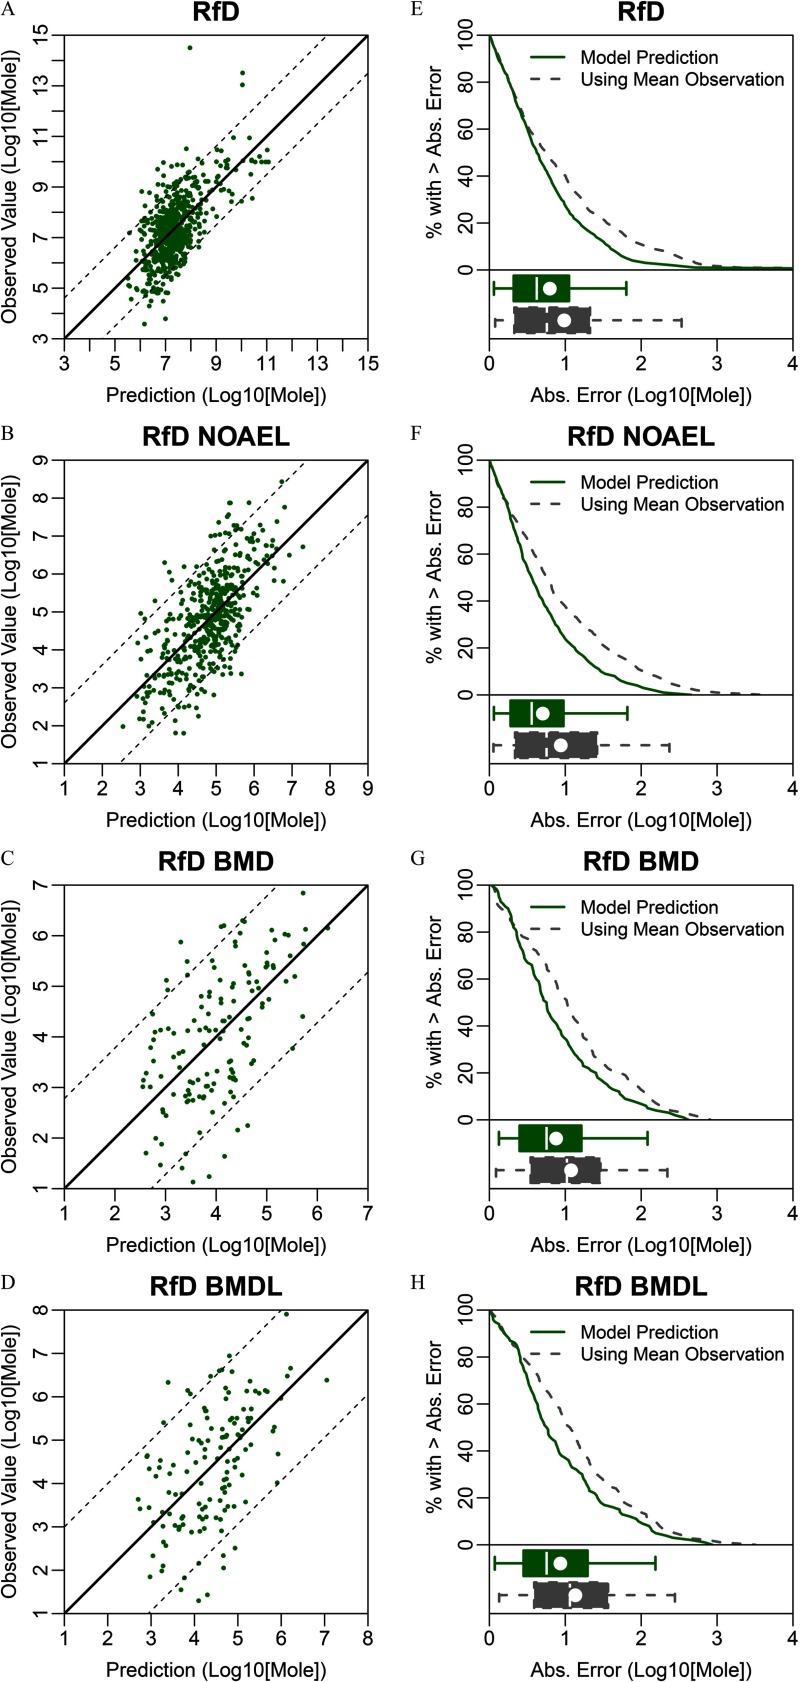
Figure 2.
Conditional toxicity value (CTV) prediction errors based on 5-fold cross-validation for the RfD and associated NOAEL, BMD, or BMDL. (A–D) Scatter plots of QSAR-predicted versus “observed” regulatory toxicity values, with the dotted lines showing the range encompassing 90% of the predictions. (E–H) Comparison of the distributions of absolute prediction errors for CTV (solid line) and an alternative model using the observed mean value for every prediction (dashed line). Box plots show the corresponding interquartile region (box), median (line in box), mean (dot in box), and 95% confidence interval (whiskers). Note: Abs., absolute; BMD, benchmark dose; BMDL, benchmark dose lower confidence limit; NOAEL, no observed adverse effect level; QSAR, quantitative structure–activity relationship; RfD, reference dose.

