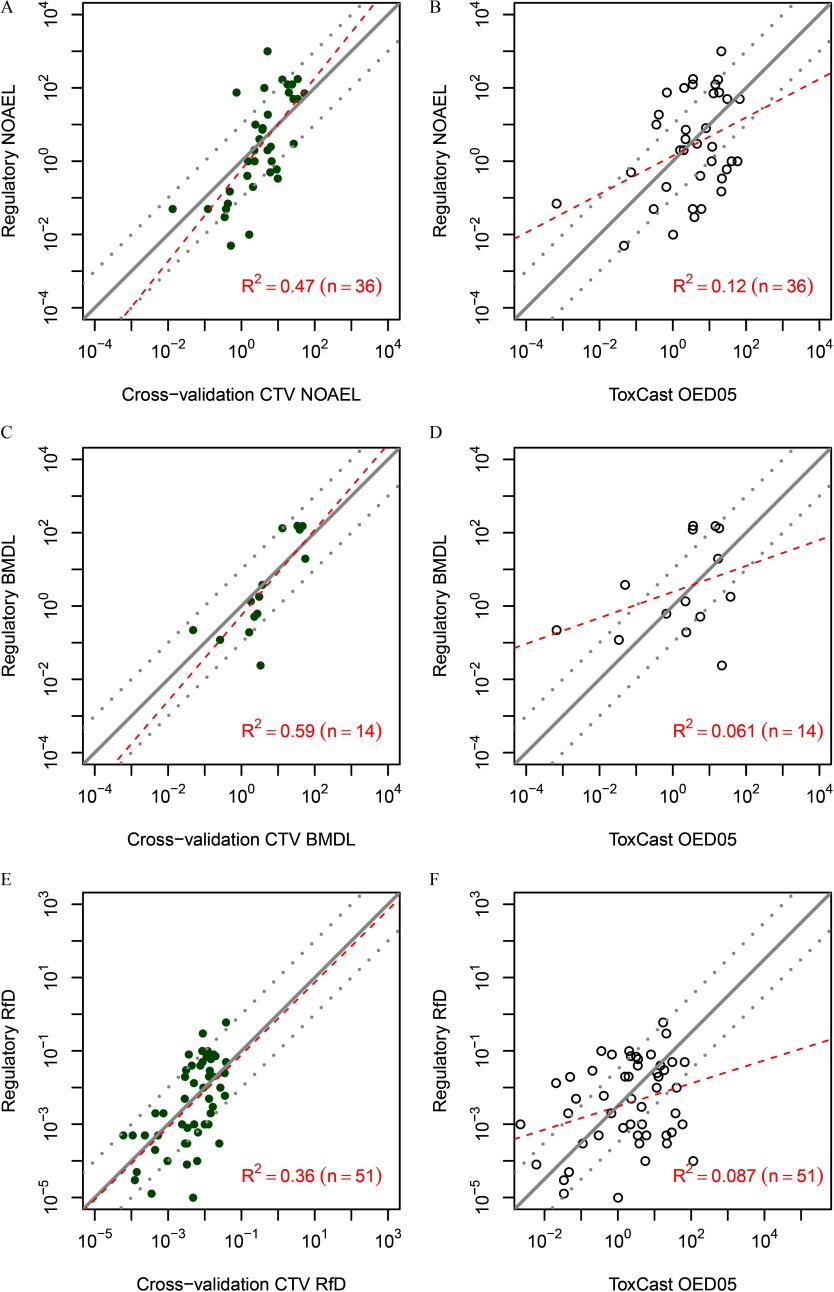
Figure 7.
Comparison of conditional toxicity value (CTV)-based (A, C, E) or high-throughput screening (HTS) assay-based (B, D, F) toxicity value predictions with “gold standard” regulatory toxicity values. In each panel, the x-axis is the toxicity value predicted from CTV (left panels) or based on HTS assays (right panels), which is compared with regulatory toxicity values on the y-axis (all values are in units of ). Comparisons are made for regulatory NOAELs (panels A and B), BMDLs (panels C and D), or RfDs (panels E and F). In all cases, the predictions from CTV are based on cross-validation (panels A, C, and E). Panels A–E also include lines indicating equality and a factor of 10 greater or less than equality (solid and dotted lines); for panel F, the line is offset by a factor of to account for the fact that the HTS-based oral equivalent dose lower 5% confidence limit () is a point of departure and is not meant to be equivalent to an RfD. The offset is approximately equivalent to treating as a surrogate for the RfD. The value of this offset was determined by the intercept of the linear regression. Each panel also includes linear regression lines (dashed lines), along with the number of compounds (n) and the adjusted . Note: BMDL, benchmark dose lower confidence limit; HTS OED05, high-throughput screening–based oral equivalent dose lower 5% confidence limit; NOAEL, no observed adverse effect level; RfD, reference dose.

