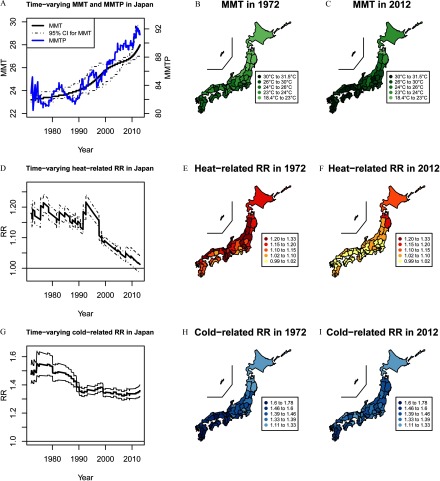
Figure 1.
Time-varying minimum mortality temperature (MMT), minimum mortality temperature percentile (MMTP), heat- and cold-related mortality risks. (A) Time-varying MMT and MMTP in Japan; (B and C) prefecture-specific MMT in 1972 and 2012; (D) time-varying heat-related mortality risk in Japan; (E and F) prefecture-specific heat-related mortality risks in 1972 and 2012; (G) time-varying cold-related mortality risk in Japan; (H and I) prefecture-specific cold-related mortality risks in 1972 and 2012. The MMT is the daily temperature associated with the lowest daily mortality; heat-related mortality risk is the relative risk (RR) comparing mortality at the 99th percentile of temperature vs. the MMT; cold-related mortality risk is the RR comparing mortality at the first percentile of temperature vs. the MMT. Black solid and dashed lines in (A), (D), and (G) indicate the central estimate and 95% pointwise confidence intervals.

