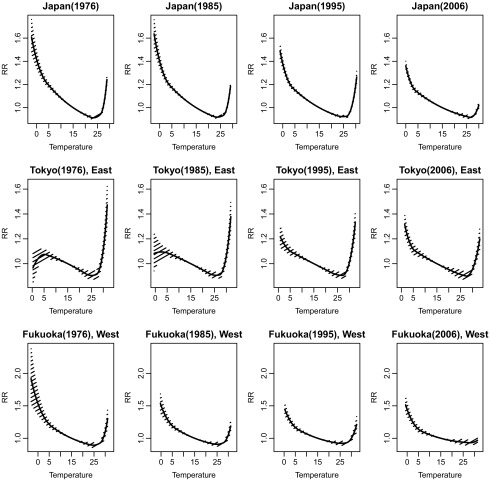
Figure 2.
Lag-cumulative relative risk (RR) curves at four time points (1976, 1985, 1996, 2006) (i.e., approximate midpoints in every decade of the study period) in Japan (the entire country), Tokyo (an eastern prefecture), and Fukuoka (a western prefecture). The RRs represent the relative risk of mortality for daily mean temperature relative to the MMT for each location and time point. Solid lines with shaded areas indicate the estimated RR curves with 95% confidence regions.

