. 2017 Mar 17;8(5):1093–1102. doi: 10.1039/c6md00649c

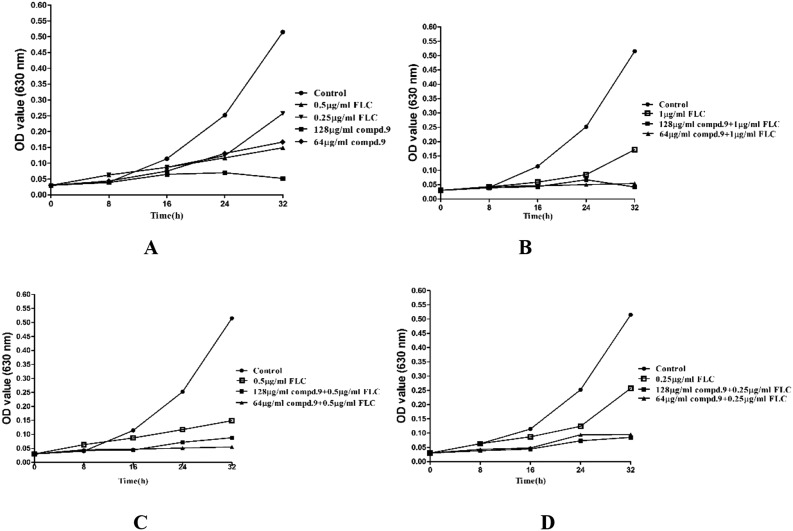
Fig. 2. Growth curves of cells with different treatments. (A) Time–growth curve for C. tropicalis 087 treated with compound 9 (64, 128 μg ml–1) or FLC (0.25, 0.5 μg ml–1) alone in RPMI 1640 medium at 30 °C for 48 h. The OD was measured at 630 nm. (B) Time–growth curve for C. tropicalis 087 treated with FLC (1 μg ml–1) or in combination with compound 9 (64, 128 μg ml–1). (C) Time–growth curve for C. tropicalis 087 treated with FLC (0.5 μg ml–1) or in combination with compound 9 (64, 128 μg ml–1). (D) Time–growth curve for C. tropicalis 087 treated with FLC (0.25 μg ml–1) or in combination with compound 9 (64, 128 μg ml–1). FLC, fluconazole; compd. 9, compound 9. Data are shown as the means ± SD from three independent experiments.

Fig. 2