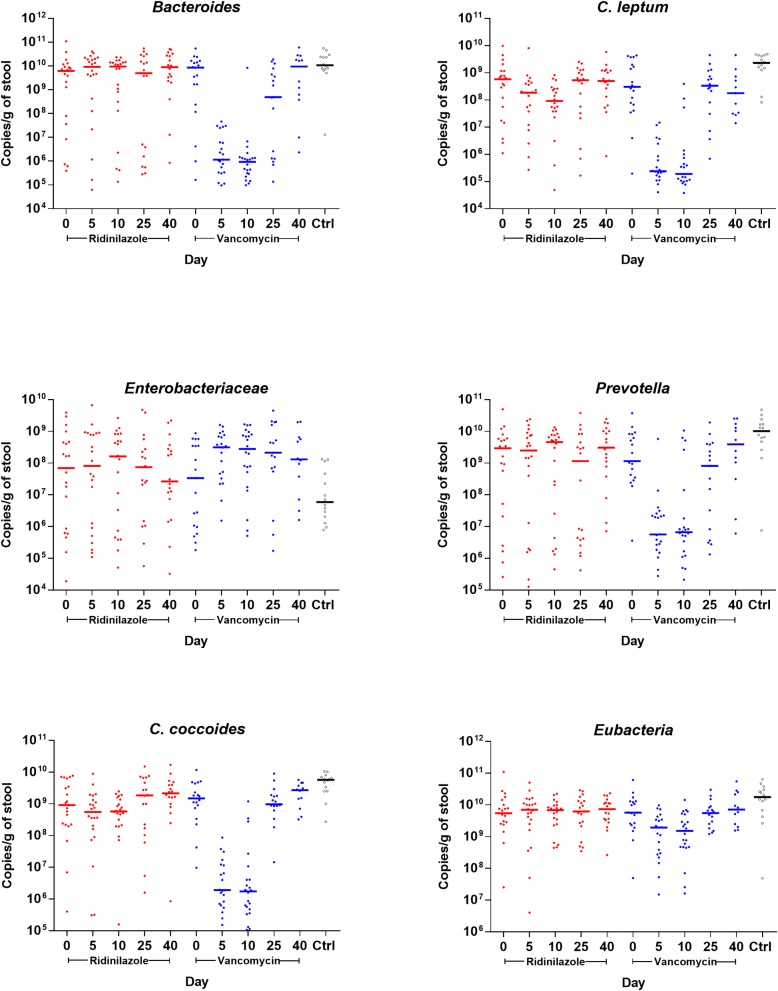
Fig 2. Microbiota levels belonging to different taxonomic groups measured by qPCR in samples from study participants and 14 healthy controls.
Red circles represent participants treated with ridinilazole and blue circles represent participants treated with vancomycin. Bolded bars represent the median of all samples at that time point.

