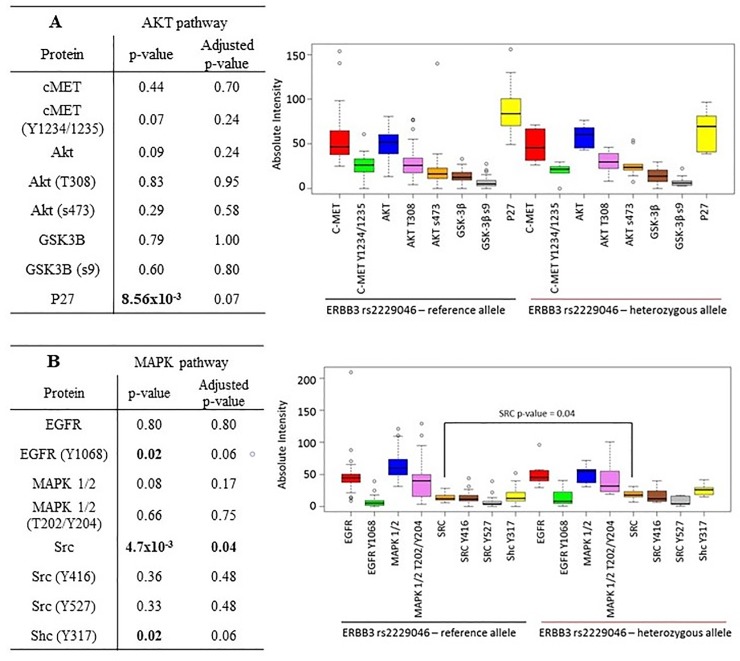
Fig 3.
Reverse Phase Protein array analysis correlating differential expression and phosphorylation of proteins involved in either the A) AKT or B) MAPK pathway versus the presence or absence of the minor allele of the ERBB3 rs2229046 SNP. p-values <0.05 included on the graph demonstrate significantly differential protein expression between the presence of the reference allele or the presence of the minor allele and are corrected for multiple testing.

