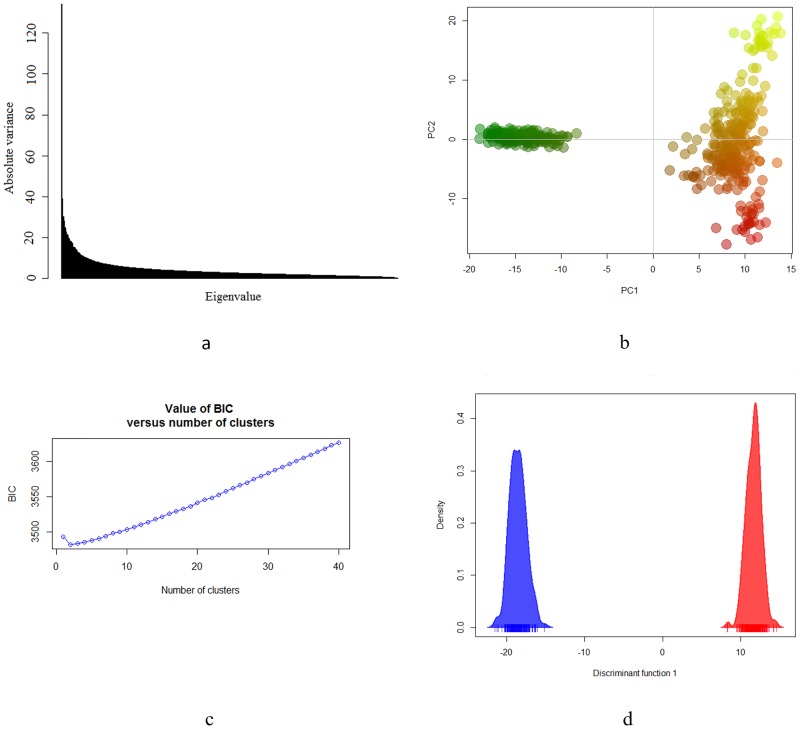
Fig 1. Genetic structure of the Brazilian Gir population.
(a) Eigenvalues of principal component analysis (PCA). (b) PCA scatter-plots of the first two principal components (PC) showing clearly separation between beef population (green color) and dairy population (red-yellow colors). (c) Inference of the number of clusters in Gir cattle based on K-means algorithm. (d) Plots of the first two discriminant functions of discriminant analysis of PC algorithm.

